Web statistics, year 2010

What has changed on the Internet in 2010? How many websites were created? How many people used the Internet? Let's try to figure it out.
To build these statistics, we used a large number of sources, you can find them at the end of the article.
Letters
- 107 trillion - letters sent in 2010
- 294 billion - the average number of messages per day
- 1.88 billion - the number of email users worldwide
- 480 million new users this year
- 89.1% - spam
- 262 billion - the number of spam emails per day (assuming 89% of spam)
- 2.9 billion email accounts
- 25% - the share of corporate accounts
Sites
- 255 million - the number of web sites in December 2010
- 21.4 million - new sites for 2010
Growth in the number of web servers in 2010
- 39.1% - Apache
- 15.3% - IIS
- 4.1% - Nginx
- 5.8% - Google GWS
- 55.7% - Lighttpd

Domains
- 88.8 million - the number of domain names at the end of 2010 in the .COM zone
- 13.2 million - the number of domain names at the end of 2010 in the .NET zone
- 8.6 million - the number of domain names at the end of 2010 in the .ORG zone
- 79.2 million - the number of top-level domains of countries (for example .CN, .UK, .DE, etc.)
- 202 million - the number of domain names in all top-level domains (October 2010)
- 7% - an increase in the number of domain names compared to 2009.
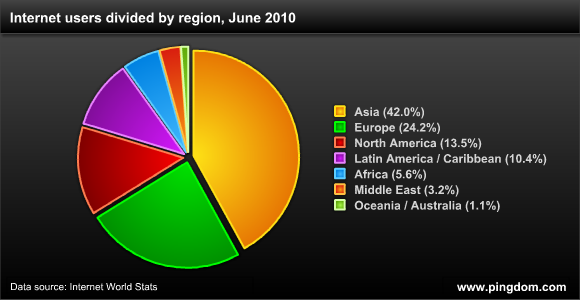
Internet users
- 1.97 billion users worldwide (June 2010)
- 14% - an increase compared to 2009
- 825.1 million - Asia
- 475.1 million - Europe
- 266.2 million - North America
- 204.7 million - Latin America and the Caribbean
- 110.9 million - Africa
- 63.2 million - in the Middle East
- 21.3 million - Oceania / Australia
')
Social media
- 152 million - the number of blogs on the Internet (according to statistics BlogPulse)
- 25 billion - the number of tweets for 2010
- 100 million new Twitter users
- 175 million people on Twitter (as of September 2010)
- 7.7 million - people subscribed to ladygaga (Lady Gaga)
- 600 million Facebook users at the end of 2010
- 250 million new Facebook users in 2010
- 30 billion - new entries in Facebook (links, notes, photos, etc.) every month
- 70% of Facebook users are outside the US
- 20 million installed applications by Facebook users every day
Browsers

Video
- 2 billion - viewed videos on YouTube, per day
- 35 - hours of video uploaded every minute to YouTube
- 186 - the average number of videos viewed per month by a YouTube user (USA)
- 84% - people watching online video (USA)
- 14% - people adding a new video (US)
- 2+ billion - viewed videos on Facebook, per month
- 20 million - uploaded clips on Facebook, per month
A photo
- 5 billion - photo on Flickr (September 2010)
- 3000+ - photos uploaded to Flickr, per minute
- 130 million - uploaded photos on Flickr, per month
- 3+ billion - uploaded photos on Facebook, per month
- 36 billion - uploaded photos on Facebook, per year, at current rates
Sources we used:
Spam as a percentage of MessageLabs (PDF)
Email Information - Radicati Group
Information on sites - Netcraft
Domain Name Statistics - Verisign and Webhosting.info
Number of Internet users and their distribution by country - Internet World Stats
Facebook Statistics - with Facebook and Business Insider
Twitter Information - Twitter Twitter ( still here ) TwitterCounter and TechCrunch
Browser Statistics - StatCounter
YouTube stats from google
Facebook Info - GigaOM
Statistics on views of clips in the US - Comscore and the Pew Research Center
Flickr Statistics - Flickr
Facebook Photo Statistics - From This Blog
Source: https://habr.com/ru/post/111864/
All Articles