MODx - Accounting visitors and schedule visits
Like many programmers, I suffer some degree of suspicion towards other services, and I prefer to do everything myself.
Others services, in particular, include liveinternet and other visitor counters. I don't trust them like that, you know.
Now I will tell you (and show) how easy it is to register visitors to your site using modx.
First we need to create a table to store visits. Make a sql query at your convenience. For example, in phpmyadmin.
The table is ready, now we need a plugin to record visits.
Most users know about snippets and chunks in modx, but plugins are usually not up to date. I tell you: a plug-in in modx, if in a simple way, is a snippet that works without a call from the document, itself, reacting to system events, of which quite a lot is provided in the engine. We are interested in the OnLogPageHit event.
')
We go to
We call the new dbLog plugin and insert the following code into it:
Switch the System events tab and set OnLogPageHit , then click save. Please note: when creating a plugin in the admin editor there should not be <? Php at the beginning and?> At the end . Snippets should, but plug-ins should not. I do not know why this is done, but when writing my first pagin, I used to swear a lot.
Everything, the plugin should already record all your visitors. If you, of course, were not mistaken anywhere!
By the way, there is another option to hang the plug-in on the OnWebPageComplete event. Then it will be necessary to enable “Register visits” in the admin settings and it will work the same tyrchik in the properties of the documents. Also not a bad option, but I have not yet run in it. More information about the events can be found here .
If you want to find out the names of the hosts that are registered on your visitors' ip, you can make another snippet ( Ip2Host ) and run it on a schedule.
Why is that? This will save the server power, because if you recognize the user's host with each page request, the load will be serious. It is better to run once a day, at night.
You need to place a call on some hidden page from outsiders:
and pull it with a cronʻom:
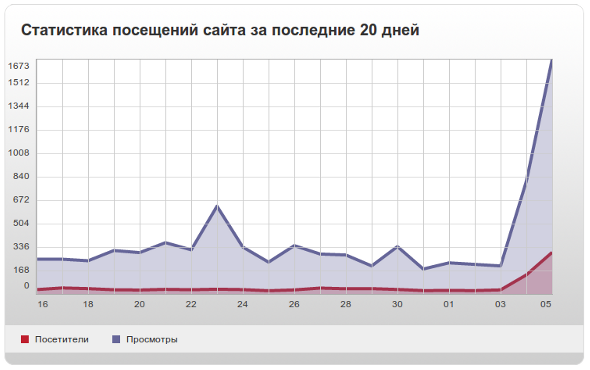
In principle, your visits are already in the database, and you can get them from there as conveniently as possible. Personally, I am pleased to observe this in the form of a nice chart and a separate plate with numbers.
So do.
We write a snippet to collect data from the database and output them to a clear table, the schedule will be done later. Comments as usual, inside the code.
Create a snippet, call it, for example, generateStatGraph , copy the code there and save.
Now we need to somehow display the result of our turbulent activity.
We need two chunk templates. the first is just for the table, the second is more difficult for plotting. They can be used independently of each other.
The first template to display the table (tpl.StatTable).
The second template for plotting (tpl.StatGraph).
As you can see, these two templates are distinguished by the presence in the second connection of a wonderful jquery jQuery Visualize plugin, which allows us to build graphs from tables. As well as the design of this schedule.
Graph rendering is started with the following code (for more details on jquery.visualize parameters, as well as design examples, click the link above):
Ufff ... Already almost everything.
Create a new modx document and run a snippet in it (separate table and chart).
I would like to note that here we considered only the display of anonymous statistics of visits, and in the database we have information about ip, time of visits, user browsers, and so on. You can view this information either directly from the database, or write a simple snippet + design chunk for output to the site, to a protected section.
To whom it is curious - it is possible to look at result in work , at the same time personally check out habraeffekt.
By the way, one can see the non-acidic difference in statistics that I collect, and which is shown by liveinternet on the counter at the bottom of each page.
Parameters for generateStatGraph snippet:
& db
& dateFormat
& days
& $ daysText
& tpl
& act
& int
Snippet placeCollers eventsCalendar:
[+ stat.days +]
[+ stat.days.text +]
[+ stat.date +]
[+ stat.host +]
[+ stat.hit +]
References to the necessary sites.
Send bugreports to bezumkin@yandex.ru, or leave them in this thread.
Others services, in particular, include liveinternet and other visitor counters. I don't trust them like that, you know.
Now I will tell you (and show) how easy it is to register visitors to your site using modx.
Stage 1. We write a log.
First we need to create a table to store visits. Make a sql query at your convenience. For example, in phpmyadmin.
CREATE TABLE IF NOT EXISTS `modx_visitors_log` ( `index` int(10) NOT NULL AUTO_INCREMENT, `ip` varchar(15) COLLATE utf8_unicode_ci NOT NULL, `host` varchar(255) COLLATE utf8_unicode_ci DEFAULT NULL, `url` text COLLATE utf8_unicode_ci NOT NULL, `datetime` timestamp NOT NULL DEFAULT CURRENT_TIMESTAMP, `referer` text COLLATE utf8_unicode_ci NOT NULL, `browser` varchar(255) NOT NULL, PRIMARY KEY (`index`), KEY `ip` (`ip`,`host`) ) ENGINE=MyISAM DEFAULT CHARSET=utf8 COLLATE=utf8_unicode_ci AUTO_INCREMENT=1 ; The table is ready, now we need a plugin to record visits.
Most users know about snippets and chunks in modx, but plugins are usually not up to date. I tell you: a plug-in in modx, if in a simple way, is a snippet that works without a call from the document, itself, reacting to system events, of which quite a lot is provided in the engine. We are interested in the OnLogPageHit event.
')
We go to
-> ->->
We call the new dbLog plugin and insert the following code into it:
/* */ // modx_visitors_log $db = '`modx_visitors_log`'; // IP. - $not_log_ip = array('192.168.100.1', '192.168.100.2'); $not_log_user = array('bezumkin'); /* */ // $login = $_SESSION['webShortname']; // . - . $ip = $_SERVER['REMOTE_ADDR']; // IP . . $host = ''; // , IP . . $url = $_SERVER['REQUEST_URI']; // . $referer = urlencode($_SERVER['HTTP_REFERER']); // , . $browser = mysql_real_escape_string($_SERVER['HTTP_USER_AGENT']); // . browscap, . . // if (!in_array($ip, $not_log_ip) and !in_array($login, $not_log_login)) { $modx->db->query("INSERT INTO $db (`login`, `ip`, `host`, `url`, `referer`,`browser`) VALUES ('$login','$ip','$host', '$url','$referer','$browser')"); } Switch the System events tab and set OnLogPageHit , then click save. Please note: when creating a plugin in the admin editor there should not be <? Php at the beginning and?> At the end . Snippets should, but plug-ins should not. I do not know why this is done, but when writing my first pagin, I used to swear a lot.
Everything, the plugin should already record all your visitors. If you, of course, were not mistaken anywhere!
By the way, there is another option to hang the plug-in on the OnWebPageComplete event. Then it will be necessary to enable “Register visits” in the admin settings and it will work the same tyrchik in the properties of the documents. Also not a bad option, but I have not yet run in it. More information about the events can be found here .
If you want to find out the names of the hosts that are registered on your visitors' ip, you can make another snippet ( Ip2Host ) and run it on a schedule.
Why is that? This will save the server power, because if you recognize the user's host with each page request, the load will be serious. It is better to run once a day, at night.
<?php $db = '`modx_visitors_log`'; // , host $sql = $modx->db->query("SELECT `ip` FROM $db WHERE `host` = '' GROUP BY `ip`"); $arr = $modx->db->makeArray($sql); // foreach ($arr as $v) { $ip = $v['ip']; // nslookup. Windows, -, , - - - . $host = `nslookup "$ip" | grep 'name =' | awk '{print $4}'`; // - , , . if (empty($host)) {$host = 'unknown';} // . $modx->db->query("UPDATE $db SET `host` = '$host' WHERE `ip` = '$ip' AND `host` = '';"); } ?> You need to place a call on some hidden page from outsiders:
[!Ip2Host!]
and pull it with a cronʻom:
10 2 * * * * user wget localhost/secret_page.html
Stage Two. Log output to the screen.
In principle, your visits are already in the database, and you can get them from there as conveniently as possible. Personally, I am pleased to observe this in the form of a nice chart and a separate plate with numbers.
So do.
We write a snippet to collect data from the database and output them to a clear table, the schedule will be done later. Comments as usual, inside the code.
<?php /* */ if (empty($db)) {$db = '`modx_visitors_log`';} // if (empty($days)) {$days = 14;} // - if (empty($daysText)) {$daysText = '';} // - , if (empty($tpl)) {$tpl = 'visitStat.tpl';} // if (empty($act)) {$act = 'graph';} // , , graph & table if (empty($dateFormat)) {$dateFormat = '%d.%m';} // , strftime() if (empty($int)) {$int = 2;} // graph. - . /* */ // , $cur = time(); $end = date("Ymd"); $start = strftime("%Y-%m-%d", ($cur - ($days * 86400))); // $sql = $modx->db->query("SELECT DATE(`datetime`) as `date`, COUNT(distinct `ip`) as `host`, COUNT(`ip`) as `hit` FROM $db WHERE DATE(`datetime`) BETWEEN '$start' AND '$end' GROUP BY DATE(`datetime`) ORDER BY `datetime` ASC"); $result = $modx->db->makeArray($sql); // 3 , , foreach($result as $v) { $date[] = $v['date']; $host[] = $v['host']; $hit[] = $v['hit']; } // graph $int , - $i = 1; foreach ($date as $v) { if ($act == 'graph') { if ($i == $int) { $i = 0; $date2 .= '<th></th>'; } else { $date2 .= '<th>'.strftime($dateFormat, strtotime($v)).'</th>'; } $i++; } else if ($act == 'table') { $date2 .= '<th>'.strftime($dateFormat, strtotime($v)).'</th>'; } } foreach ($host as $v) { $host2 .= '<td>'.$v.'</td>'; } foreach ($hit as $v) { $hit2 .= '<td>'.$v.'</td>'; } $placeholders = array('[+stat.days+]','[+stat.days.text+]','[+stat.date+]','[+stat.host+]','[+stat.hit+]'); $values = array($days, $daysText, $date2, $host2, $hit2); $html = $modx->getChunk($tpl); echo str_replace($placeholders, $values, $html); ?> Create a snippet, call it, for example, generateStatGraph , copy the code there and save.
Now we need to somehow display the result of our turbulent activity.
We need two chunk templates. the first is just for the table, the second is more difficult for plotting. They can be used independently of each other.
The first template to display the table (tpl.StatTable).
<div style='margin: auto;text-align: center;'> <table id='chart_table'> <caption> [+stat.days+] [+stat.days.text+]</caption> <thead> <tr><td></td>[+stat.date+]</tr> </thead> <tbody> <tr><th></th>[+stat.host+]</tr> <tr><th></th>[+stat.hit+]</tr> </tbody> </table> </div> The second template for plotting (tpl.StatGraph).
<link type='text/css' rel='stylesheet' href='[(site_url)]inc/css/visualize.css' /> <script type='text/javascript' src='[(site_url)]inc/js/visualize.jquery.js'></script> <script type='text/javascript'> $(document).ready(function(){ $('#chart').visualize({ type: 'area', width: '570', height: '300' }); }); </script> <div style='margin: auto;'> <table id='chart' style='display: none;'> <caption> [+stat.days+] [+stat.days.text+]</caption> <thead> <tr><td></td>[+stat.date+]</tr> </thead> <tbody> <tr><th></th>[+stat.host+]</tr> <tr><th></th>[+stat.hit+]</tr> </tbody> </table> </div> As you can see, these two templates are distinguished by the presence in the second connection of a wonderful jquery jQuery Visualize plugin, which allows us to build graphs from tables. As well as the design of this schedule.
Graph rendering is started with the following code (for more details on jquery.visualize parameters, as well as design examples, click the link above):
$(document).ready(function(){ $('#chart').visualize({ type: 'area', width: '570', height: '300' }); }); Ufff ... Already almost everything.
Stage 3. Start!
Create a new modx document and run a snippet in it (separate table and chart).
[!generateStatGraph? &days=`20` &tpl=`tpl.StatTable` &act=`table` &dateFormat=`%d <i>%b</i>` !] [!generateStatGraph? &days=`20` &daysText=`` &tpl=`tpl.StatGraph` &act=`graph` &dateFormat=`%d` !] I would like to note that here we considered only the display of anonymous statistics of visits, and in the database we have information about ip, time of visits, user browsers, and so on. You can view this information either directly from the database, or write a simple snippet + design chunk for output to the site, to a protected section.
Application.
To whom it is curious - it is possible to look at result in work , at the same time personally check out habraeffekt.
By the way, one can see the non-acidic difference in statistics that I collect, and which is shown by liveinternet on the counter at the bottom of each page.
Parameters for generateStatGraph snippet:
& db
: `modx_visitors_log`
: [string]
: , (`modx`.`modx_log`).
& dateFormat
: '%d %b %Y %H:%M'
: strftime()
: .
& days
: 14
: [int]
: .
& $ daysText
: ''
: [string]
: - , , .
& tpl
: 'tpl.StatGraph'
: modx
: .
& act
: 'graph'
: graph, table
: . graph .
& int
: 2
: [int]
: &act=`graph`, &int , . - .
Snippet placeCollers eventsCalendar:
[+ stat.days +]
[+ stat.days.text +]
.[+ stat.date +]
.[+ stat.host +]
().[+ stat.hit +]
().References to the necessary sites.
Send bugreports to bezumkin@yandex.ru, or leave them in this thread.
Source: https://habr.com/ru/post/111203/
All Articles