Voronoi turn
Instead of the preface
The lesson of the Russian language in theGeorgiannon-Russian school.
Teacher:
- Dati, this is not understandable, it must be remembered: FROM YOU is written separately, and
Kvass - together.
The joke is taken here .
Introduction
The article was inspired by the game “Wesnoth” - turn-based strategy with RPG elements. In this game, characters are moved around a map consisting of hexagonal polygons. Thus, a character surrounded on all sides can be attacked by six enemy. For this reason, the tactical component in the game is very important. The question arose: how will the transition from a map with a fixed polygon geometry to a map with an arbitrary geometry affect the gameplay?
In this post I decided to write about the possibility of using the “Voronoi diagram” as a random game card. There are several descriptions of algorithms for constructing a Voronoi diagram on the network. But all that I have read is either too superficial or written in an academic language. In general, I did not find a description suitable for the immediate implementation of the algorithm. I had to start the implementation without having a clear understanding of all the subtleties of the algorithm. I found source codes in different languages on the network, but I still didn’t have enough knowledge to translate into the language I needed and to adapt to my task. Therefore, he decided to reinvent the wheel “with slightly more round wheels and a saddle softer”.
Perhaps one of the readers met the description of a similar problem with the source codes. Then leave, please, in the comments link - compare with what happened with me.
Algorithm
So ... the series "on the fingers" continues. You can read in Russian about the Voronoi diagram in Wikipedia [ 1 ]. The bottom line is that for a random set of points (centers) on a plane (for simplicity, I consider the 2D case), this diagram is a collection of such polygons that all points inside the polygon are closer to its “center” than to the “centers” of other polygons . Accordingly, all points on the border between two polygons are located at equal distances from both centers, and the vertices of the polygons are equidistant from three or even more centers.
The most "simple" way to build a diagram is to build "median perpendiculars" between all centers, i.e. perpendiculars to the segments connecting the pairs of centers located in the middle of these segments. Then you need to find the point of intersection of the perpendiculars obtained and cut off. However, the calculations for this will need to be done most (O (n ^ 2 * log n)).
There is an algorithm so-called. Sweeping line (fortune's algorithm [ 2 ]). Its computational complexity is O (nlogn). It will be described below.
')
The essence of the algorithm
The basis of this algorithm is the use of an auxiliary object - a sweeping straight line (RF). It can be vertical or horizontal. I use horizontal 3M, moving from larger Y values to smaller ones.
The bottom line is that for each position of the RFP, only points above this line and directly on it are considered. At the same time for each of the "center" a parabola is built, the points on which are equidistant from the "center" and from the RFP. In this case, the “centers” are the foci of the corresponding parabolas, and the RFP is the director of these same parabolas.
The parabola equation has the form:
y = ((x - xf) ^ 2 + yf ^ 2 - L ^ 2) / (2 * (yf - L))
where xf , yf are the coordinates of the parabola's focus (the center of the Voronoi polygon);
L - position of ZP (Y coordinate of the current processed event).
If we construct a bottom envelope of all parabolas, then we get the so-called. Beach line. This piecewise curve plays a key role in the algorithm. The intersection points of “parabolic pieces” (let's call them break-points) lie on the borders of the polygons of the diagram. When two breakpoints converge at one point, then one of the “arches” (a piece of one of the parabolas) “collapses”, i.e. two arches adjacent to it are connected to each other. This forms the vertex of the polygon chart.
Thus, the task is reduced to detecting and processing two events — adding a new point to the list of considered centers (site event) and suspicion of the presence of a circle (event) [ 3 ]. And so on ... it was about this description that I found online in different languages. And at this conceptual level, everything looks not very difficult. But how exactly (step by step) is the detection? And what exactly to do with these events?
I will try to present in simple words.
Data structure
As mentioned above, in the algorithm, key objects are events: a point event (site event) and a circle event (circle event). These events are placed in a list, which in my case is sorted by descending Y coordinates, i.e. events with larger values of Y coordinate are placed higher in the queue and processed earlier. Thus, the first thing we need is an ordered list for storing events.
The second thing we need is a binary tree. Three types of nodes will be placed in this tree: Arc - arch (part of the parabola), this node should store the coordinates of the parabola and a link to the circle event, if there is one; BP - breakpoint, the intersection point of two parabolas; BPOwner is the root of a subtree, its children are nodes of type BP. BP and BPOwner nodes must store a link to a face. It is necessary to keep the faces in a separate list, because BP and BPOwner nodes will be deleted when processing circle events.
You can easily find the correspondence to the Arc and BP nodes in the publication [ 6 ]. BPOwner does not have a direct name - just the root of a subtree. I gave him the name only for the convenience of software implementation.
A typical binary tree diagram for the Voronoi diagram (as I imagine it) is shown in fig. one.

Fig. 1. Binary tree.
In this figure, you can immediately highlight a potentially existing circle event. If you look to the left, Arc1, Arc2, Arc3 form a triplet of foci that most likely will not lie on one straight line. There is no place for a more lap event because there are triples {Arc3 Arc3 Arc2}, {Arc3 Arc2 Arc2} and {Arc2 Arc2 Arc1}. Such a scheme for constructing a tree, albeit redundant, but easy to analyze.
More data structure can be studied in [ 6 ]. Perhaps my presentation is different from that presented in that publication, but for me it is easier.
Main loop
- Initialization of data.
- While the queue is not empty:
- Cut the first event from the queue (with the highest Y coordinate value)
- If (event = = Site Event)
ProcessSite (event) - Else
ProcessCircle (event)
- Finish all faces referenced in the binary tree.
Really easy. All the magic in event handlers.
Handling "point events"
What is the event point for our binary tree? When the RFP falls on the next point, a new parabola is added to the tree. It should be noted that, firstly, according to the algorithm, RFP moves from event to event (in demo animations to the algorithm, this line moves smoothly), and secondly, initially the parabola is a vertically directed beam. At the intersection of this beam with one of the parabolas, two “breakpoint” (BP) are formed at once. Thus, for each event of a point in the tree there is a parabola with which the intersection of the corresponding ray will occur. This can be done easily by a descent method, starting from the root of the entire tree and comparing the X coordinates of this event and the BPOwner and BP nodes. The descent takes place until the arch meets. If the arch contains a link to an existing circle event in the queue, then you need to remove this event from the queue and remove references to this event from this arch and its neighbors, the arch to the right and left. Then, instead of an arch (see Arc1 below), a subtree of the form is created:
  BPOwner
      / \
     BP BP
   / \ / \
 Arc1 Arc2 Arc2 Arc1
Now that the tree structure has changed, one should run through the tree from left to right in search of circle events. To do this, take successively three arches and check the coordinates of the foci of the corresponding parabolas for collinearity. If the three focuses do not lie on the same line, then we can construct a common circle for them. If the lowest point of this circle lies below the ZP, then you can add a circle event to the queue. The lowest point of the circle is the place where the event will occur, and the center is the point where the vertex of the Voronoi polygon will be located.
Summing up, I would say that point events only add nodes to the tree and circle events to the event queue. Nothing more is done when they occur. When a point event occurs, the coordinates of BP, the points of intersection of parabolas, are not even calculated. The “main magic” is done in the circle's event handler.
Handling "circle events"
Each event in the circle should contain a link to the arch that will be removed (“collapse”, see above) upon the occurrence of this event. It was previously written that triples of arches are considered for detecting a circle event. So, in the circle event the link to the middle arch should be kept, i.e. to the one with the value of the X coordinate between the corresponding values of the two other arches. These neighboring arches should also contain a link to the same circle event as the average one. Although I do not see any particular need for this. It is easier for me, as an “on-the-burner”, to write in the middle arch links to two adjacent arches - left and right. Due to this, it is not necessary to walk along the tree in search of the next branch with the required arch (one of the remaining two arches will be in the next branch, because the tree is binary).
Handling the circle event will consist in updating the breakpoint coordinates that directly limit the arch to be deleted. Next is the removal of the arch and two associated breakpoint. After that, you need to rebuild the tree. As a result, a new BP node will be added, and the resulting subtree will move to a higher level ...
Text such procedures are perceived rather difficult. In any case, for me, as a person without serious knowledge in the theory of graphs and binary trees, this was a non-trivial task, therefore I also bring up the illustration in fig. 2
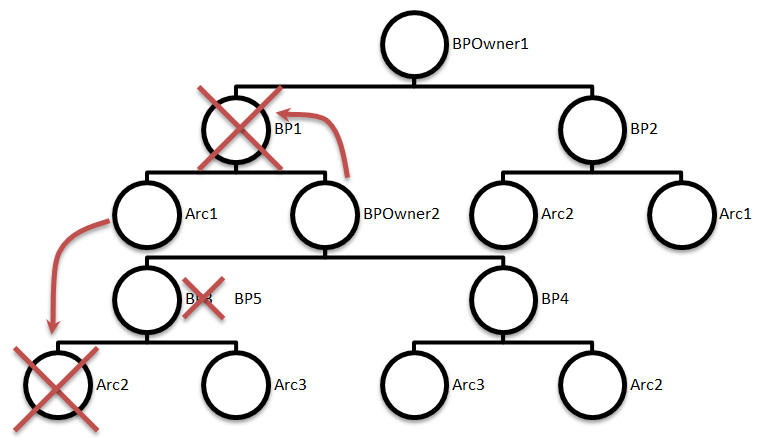
Fig. 2 Handling a circle event
Result
Here I will give a characteristic view of the diagram, i.e. type of game map with arbitrary polygonal geometry.
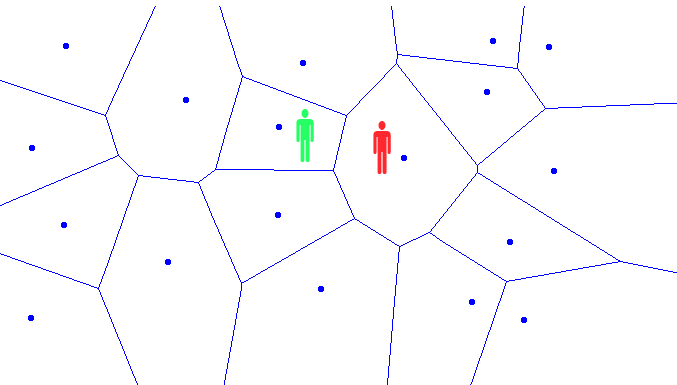
Fig.3 Game Card
Characters can be on this map in the “centers” (remember, this is the initial set of points randomly distributed over the area). Through the edges of these polygons on the character can attack the character of the enemy. In the figure above, the "green man" means ... no, not alcoholism. The polygon in which the green silhouette is placed is a safe location in terms of the number of possible attacks per opponent’s turn (maximum 4). But the character in red is not lucky. It can be a maximum of 8 attacks from unfriendly people.
Tactics
Each polygon on the map can be assigned a "cost of passage." It is possible to do otherwise - assign a “crossing cost” to the boundaries of polygons or use a combination of the two (border crossing cost + half the cost of passing). Also, depending on the area of the polygon (or the number of covered points on the map’s grid), you can assign different bonuses (frequency of artifacts, the origin of any events, etc.), protection points, fortification building resources, etc. This already provides great tactical possibilities. Plus, you should choose the right polygon where you can stop. As written in the beginning, a large polygon may have a greater number of borders, and therefore a greater number of attacks in one move of the enemy. However, a large polygon is a big bonus (subject to the appointment of bonuses depending on the area, and not on the number of borders). This means that polygons with a maximum area with a minimum number of borders will be especially valuable. This is the task of Maximin, which is easy to automate. It is more difficult to automate the successful use of the obtained bonuses for AI.
Path search can be performed using A * (“TODO” for a separate post). You can enter a system for laying paths - first the character is drawn manually, the path is recorded, and then you can use the created “waypoints” for automation. But it will probably be too uncomfortable. The gameplay can have a negative effect.
Now about the fortifications. Each landfill must have a certain set of resources to create fortifications, on which the type of fortification and the speed of construction will depend. Directly "Civilization" is obtained. The character spends action points on strengthening in the chosen position. They can be divided into two groups - defensive and attacking. At the same time, protective IPs are spent on building fortifications and defensive activity during an enemy attack (raise a shield, dodge an arrow, block an attack, etc.), and attackers can be spent both in the attack stage and in defense (counter attack, disarming). Here you can mention the ZPG "MyBrute", in which the avatar can, at defense, seize the initiatives and attack in response, without receiving a strike from the enemy.
Each character can have a set of fortifications, the construction of which he has been trained. Each type of fortification provides a different degree of security and / or bonuses. In addition to bonuses from the fortifications, the site itself can give random bonuses. Being a long time in this place, the character increases the likelihood of finding something valuable or “discovering” some hidden property of this polygon.
You can continue to continue such arguments. Space for maneuvers abound, but then we deviate from the topic of the article.
findings
Changing the geometry of the game card will inevitably lead to serious changes (I think for the better) in the tactics of the game. An additional tactical level will appear, the possibility, with the right approach at the crucial moment of the battle, to shift the balance in his direction. In addition, this approach will make the game map dynamic - to modify its topology (locally or globally). Here it is impossible not to recall the idea of the changeable locations in the STALKER games, which was not fully realized (in my opinion). In 2D, this is not very difficult to implement. But do not forget that the Voronoi diagram is constructed for 3D.
Thanks for attention! Your comments…
Bibliography
Source: https://habr.com/ru/post/110790/
All Articles