Profiling python applications
A brief note with links and examples about profiling:
For the first time I had to use Django applications for profiling, when I caught cunning recursive imports in someone else’s code. Then I used the existing handler for mod_python , but since the latter is no longer popular, alternative connection methods appeared long ago and even modules for profiling (the latter did not use).
')
Unfortunately, I don’t know the means to make it as easy and pleasant. I didn’t want to rummage through the debager, I was displeased with Guppy - he is strong, but difficult - so fortunately I don’t have to profile so often. Objgraph also does not provide easy navigation beyond the debug shell .
My choice now is dowser , an application with a CherryPy interface. Everything is easier with him, though not so flexible:
What methods and means of profiling is still worth knowing?
- performance: hotshot or python profile / cProfile + log visualizer kcachegrind (there is a port for windows , analogue of WinCacheGrind )
- memory usage: web-based dowser
performance
- We collect statistics by profiler, options:
- example 1, using quick hotshot (which can become deprecated):
import hotshot prof = hotshot.Profile("your_project.prof") prof.start() # your code goes here prof.stop() prof.close()
convert the log format using the utility from the kcachegrind-converters package:hotshot2calltree your_project.prof > your_project.out - Example 2, using the standard profile / cProfile:
python -m cProfile -o your_project.pyprof your_project.py
convert log format with pyprof2calltree :pyprof2calltree -i your_project.pyprof -o your_project.out
(with the -k option, it will immediately start kcachegrind and you do not need to create an intermediate file)
- example 1, using quick hotshot (which can become deprecated):
- open and study the log in the kcachegrind visualizer

For the first time I had to use Django applications for profiling, when I caught cunning recursive imports in someone else’s code. Then I used the existing handler for mod_python , but since the latter is no longer popular, alternative connection methods appeared long ago and even modules for profiling (the latter did not use).
')
memory
Unfortunately, I don’t know the means to make it as easy and pleasant. I didn’t want to rummage through the debager, I was displeased with Guppy - he is strong, but difficult - so fortunately I don’t have to profile so often. Objgraph also does not provide easy navigation beyond the debug shell .
My choice now is dowser , an application with a CherryPy interface. Everything is easier with him, though not so flexible:
- create a controller, essentially a CherryPy 3 application:
# memdebug.py import cherrypy import dowser def start(port): cherrypy.tree.mount(dowser.Root()) cherrypy.config.update({ 'environment': 'embedded', 'server.socket_port': port }) cherrypy.engine.start() - connect to your application:
import memdebug memdebug.start(8080) # your code goes here - go to the browser and view the statistics (ignoring CherryPy objects, other libraries - we are only looking for ours)
http://localhost:8080/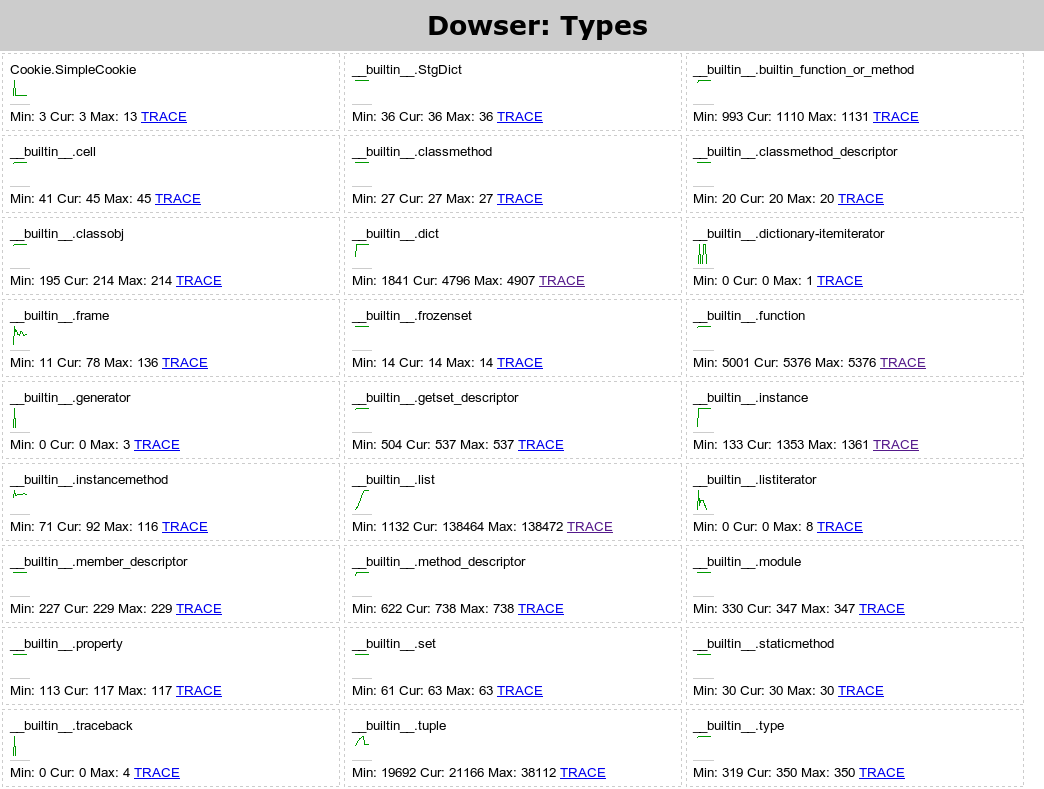
The functionality is austere, we will have to click and understand a bit, but it is quite enough to find problems. No need to learn and memorize the debugger API. Attention, on some operations like “Show the entire tree”, may require a real amount of memory for large applications. - the application itself will not close. After studying we interrupt Ctrl + Z and kill
What methods and means of profiling is still worth knowing?
Source: https://habr.com/ru/post/110537/
All Articles