Module ustats: statistics of requests to backends
Greetings
This article will discuss a new module for nginx, the purpose of which is to collect and provide the user with statistics on server backend server access. Under the cut - details, examples of use, screenshots, links, as well as the history of creation.
Not so long ago, in the server support department of our company, we came to the conclusion that it was time to change something. More precisely, it was necessary to solve problems with the distribution of the increased load - our fronts began to cope with their task with difficulty.
')
With the help of JMeter, we drove to the stand of nginx, HAProxy, Brocade Server Iron ADX 1000 and a number of other balancers. The main selection criterion was the possibility of termination of about 50 thousand simultaneous ssl-sessions during peak periods. After long testing, for various reasons, all options except nginx and its iron competitor Brocade Server have disappeared, and only the first of them has remained. All other things being equal, probably decisive factors in favor of nginx were the flexibility of its configuration and lightness.
Earlier, HAProxy was used as a balancer on some fronts. After switching to nginx, it became clear that we lack in it some informative statistics of work with backends. The fact is that the same HAProxy had such statistics, and with its help we tracked the problems arising on the backends and promptly reacted to them. With the new balancer, we were left without these statistics, like without hands. stub_status and similar modules did not suit us, since Their function is to show statistics not in the context of a separate Upstream, but of the server as a whole. We also wanted for each upstream / backend to have data on such parameters as the number of calls to each backend and the number of HTTP errors 499/500/503 and TCP , and this list later expanded.
Since we did not find any ready-made solutions to our problem, an attempt was made to write a module that would provide the necessary information in a visual form. The attempt, I think, was a success, and the result was the module ustats ( upstream statistics ).
With ustats, you can keep statistics on such backend indicators as
Also ustats can show which backends are currently on the black list. I will note that a backend is understood not as what is indicated in the nginx configuration by the server directive, but directly at the address where the name specified in the directive is located. If there are several addresses behind one name in the DNS, then the module shows them as separate backends (not forgetting to indicate what name they came from).
In addition to highlighting backends from the blacklist, ustats highlights off the server, i.e. described in the nginx config as
And finally, using the module, you can turn on and off the servers from the nginx topology while it is running, via the web interface. Changes are not saved in the config and are designed to facilitate the conduct of those. works involving the temporary disconnection of backends. I want to warn: ustats does not provide any protection against unauthorized execution of this action, so you have to independently ensure that a random person does not exclude half of the backends on your site from work :)
There are two of them. Firstly, the module provides all the statistics in the form of a web page with a table, the display of which can be hung on any location, like stub_status:
The page is automatically updated, and the update interval (in milliseconds) can be configured in the config:
The second scenario assumes that the module is used as a data source for other monitoring utilities. In this case, corresponding requests are made to it, in response to which it returns an ordinary xml with the necessary information. You can request data on one upstream or one backend. For example, the query
returns data on all backends in upstream offline , and on request
back data from the_mold backend in upstream break . If an upstream or backend is not found, the response xml will say this.
Not to be unfounded, here are some screenshots of the page, the result of the module. In nginx, from the first snapshot, there are 2 upstream configured, in which all servers are local, raised on the same nginx, except for the www server — it resolves to Yandex addresses:

In the photo you can see the gray lines - these are backends marked as “down” in the nginx config, or turned off via the module page. No figures yet.
In the second screenshot, the red lines highlight three backends from the first upstream that were on the black list, which prevented sending requests to them.
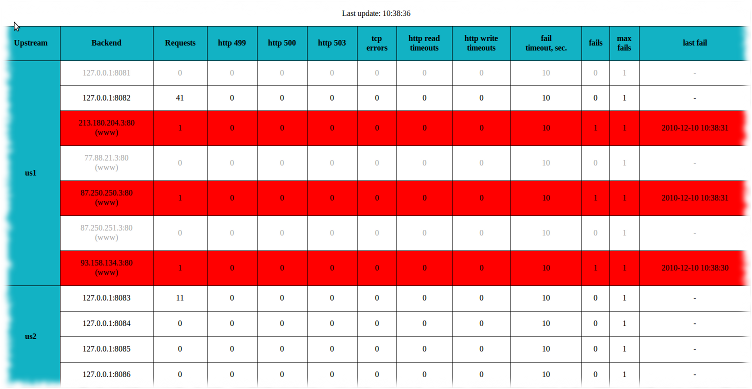
Coupled with the fact that three more backends were turned off, the only remaining one took over the entire load.
Finally, the last picture was taken on the working front-end from our site:

The picture shows another feature, which I have not mentioned. Upstream lights are lit a little lighter below - this is a sign that they are defined in the config file implicitly, i.e. not this way
and so
We posted the source code module on the page Google Code. The repository contains the patch file for nginx, the source file + the configuration file. On the module page there are installation instructions, and additional configuration directives are also described there. The current version of the module was tested with nginx version 0.8.53 in Chrome, Firefox and Opera browsers. Finally, I must say that ustats is just an attempt to add the most basic mechanism for displaying data on working with backends to nginx. In the future, I would like to see such useful modules in the main branch of the server as, for example, advanced health check backends.
This article will discuss a new module for nginx, the purpose of which is to collect and provide the user with statistics on server backend server access. Under the cut - details, examples of use, screenshots, links, as well as the history of creation.
Story
Not so long ago, in the server support department of our company, we came to the conclusion that it was time to change something. More precisely, it was necessary to solve problems with the distribution of the increased load - our fronts began to cope with their task with difficulty.
')
With the help of JMeter, we drove to the stand of nginx, HAProxy, Brocade Server Iron ADX 1000 and a number of other balancers. The main selection criterion was the possibility of termination of about 50 thousand simultaneous ssl-sessions during peak periods. After long testing, for various reasons, all options except nginx and its iron competitor Brocade Server have disappeared, and only the first of them has remained. All other things being equal, probably decisive factors in favor of nginx were the flexibility of its configuration and lightness.
Problem
Earlier, HAProxy was used as a balancer on some fronts. After switching to nginx, it became clear that we lack in it some informative statistics of work with backends. The fact is that the same HAProxy had such statistics, and with its help we tracked the problems arising on the backends and promptly reacted to them. With the new balancer, we were left without these statistics, like without hands. stub_status and similar modules did not suit us, since Their function is to show statistics not in the context of a separate Upstream, but of the server as a whole. We also wanted for each upstream / backend to have data on such parameters as the number of calls to each backend and the number of HTTP errors 499/500/503 and TCP , and this list later expanded.
Decision
Since we did not find any ready-made solutions to our problem, an attempt was made to write a module that would provide the necessary information in a visual form. The attempt, I think, was a success, and the result was the module ustats ( upstream statistics ).
What statistics?
With ustats, you can keep statistics on such backend indicators as
- Number of requests .
- The number of errors 499/500/503 .
- The number of HTTP timeouts read and write .
- The number of TCP connection errors .
- Failure timer (fail_timeout) . In nginx, this parameter is configured by the directive of the same name and determines the period of time during which several unsuccessful backend calls should occur in succession (the exact number is indicated by the max_fails directive), after which the backend is placed on the black list, and there are no calls to it yet time fail_timeout. Usually, the administrator and himself know what timeouts are registered in his server config, but still it seemed like a good idea to have them in front of them.
- The number of failed attempts to work with the backend (fails count) . Inside nginx for each backend there is a counter of unsuccessful attempts to work. This number shows how many times during the fail timeout time nginx tried to knock on the backend and failed (for what is considered a failure, see the description of the proxy_pass directive). The principle of operation of the counter is quite simple. When nginx is going to redirect the request, it first looks at which backend is next in line (if it’s about round robin balancing), checks its status (on the black list or not), and if the backend is “ignored”, the server looks at the time of its last failure . If the fail_timeout time has already passed since then, the counter of failed attempts for the backend is reset and the request is sent. If the backend was not on the black list, then the request is sent immediately, and the counter may be reset, depending on the time that has passed since the first unsuccessful call.
- Maximum number of failed calls (max_fails) . Defines the threshold for the number of unsuccessful attempts to work with the backend, at which it is placed on the blacklist for the period of time fail_timeout. This parameter is also written in the nginx config, and we added its mapping to the statistics for clarity.
- Last unsuccessful call to backend. His appointment should be clear from the previous paragraphs :)
Additional functions
Also ustats can show which backends are currently on the black list. I will note that a backend is understood not as what is indicated in the nginx configuration by the server directive, but directly at the address where the name specified in the directive is located. If there are several addresses behind one name in the DNS, then the module shows them as separate backends (not forgetting to indicate what name they came from).
In addition to highlighting backends from the blacklist, ustats highlights off the server, i.e. described in the nginx config as
 ...
 server some.server.name down;
 ...
And finally, using the module, you can turn on and off the servers from the nginx topology while it is running, via the web interface. Changes are not saved in the config and are designed to facilitate the conduct of those. works involving the temporary disconnection of backends. I want to warn: ustats does not provide any protection against unauthorized execution of this action, so you have to independently ensure that a random person does not exclude half of the backends on your site from work :)
Usage scenarios
There are two of them. Firstly, the module provides all the statistics in the form of a web page with a table, the display of which can be hung on any location, like stub_status:
 location / ustats {
	 ustats on;
	 ...
 }
The page is automatically updated, and the update interval (in milliseconds) can be configured in the config:
 ...
 ustats_refresh_interval 7000
 ...
The second scenario assumes that the module is used as a data source for other monitoring utilities. In this case, corresponding requests are made to it, in response to which it returns an ordinary xml with the necessary information. You can request data on one upstream or one backend. For example, the query
/ ustats? u = offline
returns data on all backends in upstream offline , and on request
/ ustats? u = break & b = the_mold
back data from the_mold backend in upstream break . If an upstream or backend is not found, the response xml will say this.
Some pictures
Not to be unfounded, here are some screenshots of the page, the result of the module. In nginx, from the first snapshot, there are 2 upstream configured, in which all servers are local, raised on the same nginx, except for the www server — it resolves to Yandex addresses:
In the photo you can see the gray lines - these are backends marked as “down” in the nginx config, or turned off via the module page. No figures yet.
In the second screenshot, the red lines highlight three backends from the first upstream that were on the black list, which prevented sending requests to them.
Coupled with the fact that three more backends were turned off, the only remaining one took over the entire load.
Finally, the last picture was taken on the working front-end from our site:
The picture shows another feature, which I have not mentioned. Upstream lights are lit a little lighter below - this is a sign that they are defined in the config file implicitly, i.e. not this way
 upstream give_me_a_name {
   ...
 }
and so
 location / whereami {
 ...
 proxy_pass http://192.168.0.75:8080
 ...
 }
Total
We posted the source code module on the page Google Code. The repository contains the patch file for nginx, the source file + the configuration file. On the module page there are installation instructions, and additional configuration directives are also described there. The current version of the module was tested with nginx version 0.8.53 in Chrome, Firefox and Opera browsers. Finally, I must say that ustats is just an attempt to add the most basic mechanism for displaying data on working with backends to nginx. In the future, I would like to see such useful modules in the main branch of the server as, for example, advanced health check backends.
Source: https://habr.com/ru/post/110047/
All Articles