ASP.NET Profiler Overview
Almost a year ago, an article was published about the use of an application profiler in Visual Studio 2010. In the comments, it was suggested that it would be nice to compare this product with similar ones. I will try to conduct a brief review and comparison of the 4 most famous .NET profilers.
In the review involved:
What do we expect from the profiler? We need absolute (time) and relative (percentage) statistics on the execution of individual sections of the code (if possible, up to a line). After optimizing some critical sections of the code, you need to run the profiling again and compare the results.
Since by the nature of my activity I am associated with web development, an ASP.NET application ( download ) will be used as an experimental one:
A small lyrical digression. At first I wanted to choose a real application for profiling. The choice fell on Tailspin Spyworks , which is used as a steb-by-step guide. It would seem that the guide for newbies should be so polished to immediately interest the developer, to teach some right things. And what did I see there? A curved layout, a mix of business logic and markup, non-optimal queries to the database, select * even if 1-2 fields are stretched ... It was very difficult to perform all optimizations 4 times (for 4 profilers), so for 3 minutes it was written used in tests attachment. If anyone is interested, in future articles it will be possible to disassemble by bone Tailspin Spyworks.
')
Pretty lyrics, run profilers.
The launch is done from VS through the menu Analyze -> Launch Perfomance Wizard.
With a few simple steps, we select the type of profiling (I chose Instrumentation, because CPU sampling does not show the execution time, only in percents), the projects under study and whether it is necessary to profile database queries through ADO.NET.
After clicking the Finish button, the browser is launched, while in the studio there will be a splash screen with the Pause and Stop buttons.
After the page has finished loading in the browser, click Stop and get the result:
We will not dwell on the profiler description; it is done quite well here , here and here .
Here is the statistics screen for the methods:

Now you need to optimize the critical parts of the code SampleBadMethod1 and SampleBadMethod2. As an “optimization”, we reduce the number of iterations in a cycle (for example, from 100 to 50 and from 10,000 to 1,000).
Once again we get the result and through the menu item Analyze-> Compare Performance Reports we compare the result:
Well, we are great, we managed to speed up our application.
Repeat the same actions with other profilers.
When creating a new profiling session, the following window appears:
Here you can select the type of application, profiling options and enter application data, for example, for an ASP.NET application on a dev server, the path to the application, the .net version, the port number, etc.
After clicking the Start Profiling button, the browser is started, at this time the ANTS Profiler draws a graph of the processor load on the time axis.
Press the Stop Profiling button and get the result:
I will not consider in detail the purpose and functions of the screen areas (this is the topic of a separate article), I’ll briefly say that you can see the timeline with CPU usage (or any other indicator that you can choose yourself) in the upper part, in the center of the tree with execution statistics by time and number of calls, at the bottom, viewing the source code of the methods (if the code is available).
There is some oddity here: we see that the total execution time of the SampleBadSubMethod2 method is 14 ms, although there is a delay of 1 ms inside it and it is called 10,000 times. Perhaps ANTS somehow incorrectly handles the Thread.Sleep method.
Now we “optimize” the application again, run the profiler, get the result and ... cannot compare using ANTS ... The FAQ on the site suggests starting another profiler and switching between them, comparing the result. Well, thank you, what else to say :)
Enters the battle
When you select File-> Profile window appears:
Select the type of application, set the settings and Run!
After starting the profiling, a small window appears with which you can get a result (Get Snapshot) or complete the profiling.
After receiving the result we will see the following window:

Here we see a tree of methods with percentages and runtime. In the right part you can see the source of one or another method.
We optimize the application, get the result and compare it with the original:
Well, the optimization was a success.
And finally
Run profiler, see the window:
Here you need to choose the path to the bin folder of the application, select the assemblies that you want to explore, click Build.
Then launch your favorite browser and load the application page. If everything is fine, then the message Profiled appication xxx started appears in the log and the Take snapshot and Reset counters buttons become active.
Next, click "Take snapshot":
And here is our snapshot:

We see call statistics, as well as the presentation of methods as blocks (at the bottom). These blocks are clickable, i.e. You can navigate the call up / down hierarchy.
Now once again we optimize the application and compare the result:
We did a great job again, sped up the application many times.
That's all, look at the summary table of possibilities presented by profilers
1) as part of VS Premium and above
2) depends on the wording
3) free for open source projects
4) limitation on 10 simultaneously loaded dll, for $ with less restrictions
Now we will consider the advantages and disadvantages I have noticed for each profiler separately, not indicated in the comparative table.
 built into VS (true to premium and ultimate)
interaction with ADO.NET
 capricious, sometimes profiling doesn't start without explanation
The appSettings section should be in the web.config, and not in a separate file, because some service settings are written there, and the developers apparently did not provide for the location of this section in an external file
on a big project and a not very powerful machine, it slows down noticeably
most detailed information on method calls, a bunch of performance counters
in the profile mode, SQL thinks that besides ./SQLEXPRESS servers no longer exist :)
no comparison of two measurement results
most liked the documentation
in the tree view mode, some kind of a mess of numbers, method names, assemblies
It did not start in IIS Application mode, although I did everything according to good documentation.
small and fast, suitable if you do not need to look at performance line by line and do not need source
This minus is a consequence of a plus: less than other competitors have.
So, I will make, perhaps, a subjective conclusion. My choice is EQATEC Profiler, for many tasks it’s more than enough performance evaluation. If you can use VS Premium or Ultimate, the built-in profiler is a pretty good product. In this case, the need to purchase other profilers will disappear. Of the remaining two profilers, the ANTS profiler is striking in its power, although it is not clear why there is no comparison of the results. DotTrace has an abundance of purchase options with a lot of features of the profiler itself.
Thank you for reading this review! I hope he helps you make a choice.
PS Suggestions for a detailed review of each profiler are accepted.
In the review involved:
- a profiler built into Visual Studio 2010 (starting with Premium Edition) ( MSDN , blog );
- ANTS Performance profiler from RedGate;
- dotTrace from JetBrains;
- EQATEC Profiler from EQATEC.
What do we expect from the profiler? We need absolute (time) and relative (percentage) statistics on the execution of individual sections of the code (if possible, up to a line). After optimizing some critical sections of the code, you need to run the profiling again and compare the results.
Since by the nature of my activity I am associated with web development, an ASP.NET application ( download ) will be used as an experimental one:
public partial class Default : System.Web.UI. Page { protected void Page_Load( object sender, EventArgs e) { SampleBadMethod1(); SampleBadMethod2(); } private void SampleBadMethod1() { for ( int i = 0; i < 100; i++) { SampleBadSubMethod1(); } } private void SampleBadSubMethod1() { Thread.Sleep(10); } private void SampleBadMethod2() { for ( int i = 0; i < 10000; i++) { SampleBadSubMethod2(); } } private void SampleBadSubMethod2() { Thread.Sleep(1); } } * This source code was highlighted with Source Code Highlighter .
public partial class Default : System.Web.UI. Page { protected void Page_Load( object sender, EventArgs e) { SampleBadMethod1(); SampleBadMethod2(); } private void SampleBadMethod1() { for ( int i = 0; i < 100; i++) { SampleBadSubMethod1(); } } private void SampleBadSubMethod1() { Thread.Sleep(10); } private void SampleBadMethod2() { for ( int i = 0; i < 10000; i++) { SampleBadSubMethod2(); } } private void SampleBadSubMethod2() { Thread.Sleep(1); } } * This source code was highlighted with Source Code Highlighter .public partial class Default : System.Web.UI. Page { protected void Page_Load( object sender, EventArgs e) { SampleBadMethod1(); SampleBadMethod2(); } private void SampleBadMethod1() { for ( int i = 0; i < 100; i++) { SampleBadSubMethod1(); } } private void SampleBadSubMethod1() { Thread.Sleep(10); } private void SampleBadMethod2() { for ( int i = 0; i < 10000; i++) { SampleBadSubMethod2(); } } private void SampleBadSubMethod2() { Thread.Sleep(1); } } * This source code was highlighted with Source Code Highlighter .public partial class Default : System.Web.UI. Page { protected void Page_Load( object sender, EventArgs e) { SampleBadMethod1(); SampleBadMethod2(); } private void SampleBadMethod1() { for ( int i = 0; i < 100; i++) { SampleBadSubMethod1(); } } private void SampleBadSubMethod1() { Thread.Sleep(10); } private void SampleBadMethod2() { for ( int i = 0; i < 10000; i++) { SampleBadSubMethod2(); } } private void SampleBadSubMethod2() { Thread.Sleep(1); } } * This source code was highlighted with Source Code Highlighter .public partial class Default : System.Web.UI. Page { protected void Page_Load( object sender, EventArgs e) { SampleBadMethod1(); SampleBadMethod2(); } private void SampleBadMethod1() { for ( int i = 0; i < 100; i++) { SampleBadSubMethod1(); } } private void SampleBadSubMethod1() { Thread.Sleep(10); } private void SampleBadMethod2() { for ( int i = 0; i < 10000; i++) { SampleBadSubMethod2(); } } private void SampleBadSubMethod2() { Thread.Sleep(1); } } * This source code was highlighted with Source Code Highlighter .public partial class Default : System.Web.UI. Page { protected void Page_Load( object sender, EventArgs e) { SampleBadMethod1(); SampleBadMethod2(); } private void SampleBadMethod1() { for ( int i = 0; i < 100; i++) { SampleBadSubMethod1(); } } private void SampleBadSubMethod1() { Thread.Sleep(10); } private void SampleBadMethod2() { for ( int i = 0; i < 10000; i++) { SampleBadSubMethod2(); } } private void SampleBadSubMethod2() { Thread.Sleep(1); } } * This source code was highlighted with Source Code Highlighter .public partial class Default : System.Web.UI. Page { protected void Page_Load( object sender, EventArgs e) { SampleBadMethod1(); SampleBadMethod2(); } private void SampleBadMethod1() { for ( int i = 0; i < 100; i++) { SampleBadSubMethod1(); } } private void SampleBadSubMethod1() { Thread.Sleep(10); } private void SampleBadMethod2() { for ( int i = 0; i < 10000; i++) { SampleBadSubMethod2(); } } private void SampleBadSubMethod2() { Thread.Sleep(1); } } * This source code was highlighted with Source Code Highlighter .public partial class Default : System.Web.UI. Page { protected void Page_Load( object sender, EventArgs e) { SampleBadMethod1(); SampleBadMethod2(); } private void SampleBadMethod1() { for ( int i = 0; i < 100; i++) { SampleBadSubMethod1(); } } private void SampleBadSubMethod1() { Thread.Sleep(10); } private void SampleBadMethod2() { for ( int i = 0; i < 10000; i++) { SampleBadSubMethod2(); } } private void SampleBadSubMethod2() { Thread.Sleep(1); } } * This source code was highlighted with Source Code Highlighter .public partial class Default : System.Web.UI. Page { protected void Page_Load( object sender, EventArgs e) { SampleBadMethod1(); SampleBadMethod2(); } private void SampleBadMethod1() { for ( int i = 0; i < 100; i++) { SampleBadSubMethod1(); } } private void SampleBadSubMethod1() { Thread.Sleep(10); } private void SampleBadMethod2() { for ( int i = 0; i < 10000; i++) { SampleBadSubMethod2(); } } private void SampleBadSubMethod2() { Thread.Sleep(1); } } * This source code was highlighted with Source Code Highlighter .public partial class Default : System.Web.UI. Page { protected void Page_Load( object sender, EventArgs e) { SampleBadMethod1(); SampleBadMethod2(); } private void SampleBadMethod1() { for ( int i = 0; i < 100; i++) { SampleBadSubMethod1(); } } private void SampleBadSubMethod1() { Thread.Sleep(10); } private void SampleBadMethod2() { for ( int i = 0; i < 10000; i++) { SampleBadSubMethod2(); } } private void SampleBadSubMethod2() { Thread.Sleep(1); } } * This source code was highlighted with Source Code Highlighter .public partial class Default : System.Web.UI. Page { protected void Page_Load( object sender, EventArgs e) { SampleBadMethod1(); SampleBadMethod2(); } private void SampleBadMethod1() { for ( int i = 0; i < 100; i++) { SampleBadSubMethod1(); } } private void SampleBadSubMethod1() { Thread.Sleep(10); } private void SampleBadMethod2() { for ( int i = 0; i < 10000; i++) { SampleBadSubMethod2(); } } private void SampleBadSubMethod2() { Thread.Sleep(1); } } * This source code was highlighted with Source Code Highlighter .public partial class Default : System.Web.UI. Page { protected void Page_Load( object sender, EventArgs e) { SampleBadMethod1(); SampleBadMethod2(); } private void SampleBadMethod1() { for ( int i = 0; i < 100; i++) { SampleBadSubMethod1(); } } private void SampleBadSubMethod1() { Thread.Sleep(10); } private void SampleBadMethod2() { for ( int i = 0; i < 10000; i++) { SampleBadSubMethod2(); } } private void SampleBadSubMethod2() { Thread.Sleep(1); } } * This source code was highlighted with Source Code Highlighter .public partial class Default : System.Web.UI. Page { protected void Page_Load( object sender, EventArgs e) { SampleBadMethod1(); SampleBadMethod2(); } private void SampleBadMethod1() { for ( int i = 0; i < 100; i++) { SampleBadSubMethod1(); } } private void SampleBadSubMethod1() { Thread.Sleep(10); } private void SampleBadMethod2() { for ( int i = 0; i < 10000; i++) { SampleBadSubMethod2(); } } private void SampleBadSubMethod2() { Thread.Sleep(1); } } * This source code was highlighted with Source Code Highlighter .public partial class Default : System.Web.UI. Page { protected void Page_Load( object sender, EventArgs e) { SampleBadMethod1(); SampleBadMethod2(); } private void SampleBadMethod1() { for ( int i = 0; i < 100; i++) { SampleBadSubMethod1(); } } private void SampleBadSubMethod1() { Thread.Sleep(10); } private void SampleBadMethod2() { for ( int i = 0; i < 10000; i++) { SampleBadSubMethod2(); } } private void SampleBadSubMethod2() { Thread.Sleep(1); } } * This source code was highlighted with Source Code Highlighter .public partial class Default : System.Web.UI. Page { protected void Page_Load( object sender, EventArgs e) { SampleBadMethod1(); SampleBadMethod2(); } private void SampleBadMethod1() { for ( int i = 0; i < 100; i++) { SampleBadSubMethod1(); } } private void SampleBadSubMethod1() { Thread.Sleep(10); } private void SampleBadMethod2() { for ( int i = 0; i < 10000; i++) { SampleBadSubMethod2(); } } private void SampleBadSubMethod2() { Thread.Sleep(1); } } * This source code was highlighted with Source Code Highlighter .public partial class Default : System.Web.UI. Page { protected void Page_Load( object sender, EventArgs e) { SampleBadMethod1(); SampleBadMethod2(); } private void SampleBadMethod1() { for ( int i = 0; i < 100; i++) { SampleBadSubMethod1(); } } private void SampleBadSubMethod1() { Thread.Sleep(10); } private void SampleBadMethod2() { for ( int i = 0; i < 10000; i++) { SampleBadSubMethod2(); } } private void SampleBadSubMethod2() { Thread.Sleep(1); } } * This source code was highlighted with Source Code Highlighter .public partial class Default : System.Web.UI. Page { protected void Page_Load( object sender, EventArgs e) { SampleBadMethod1(); SampleBadMethod2(); } private void SampleBadMethod1() { for ( int i = 0; i < 100; i++) { SampleBadSubMethod1(); } } private void SampleBadSubMethod1() { Thread.Sleep(10); } private void SampleBadMethod2() { for ( int i = 0; i < 10000; i++) { SampleBadSubMethod2(); } } private void SampleBadSubMethod2() { Thread.Sleep(1); } } * This source code was highlighted with Source Code Highlighter .public partial class Default : System.Web.UI. Page { protected void Page_Load( object sender, EventArgs e) { SampleBadMethod1(); SampleBadMethod2(); } private void SampleBadMethod1() { for ( int i = 0; i < 100; i++) { SampleBadSubMethod1(); } } private void SampleBadSubMethod1() { Thread.Sleep(10); } private void SampleBadMethod2() { for ( int i = 0; i < 10000; i++) { SampleBadSubMethod2(); } } private void SampleBadSubMethod2() { Thread.Sleep(1); } } * This source code was highlighted with Source Code Highlighter .public partial class Default : System.Web.UI. Page { protected void Page_Load( object sender, EventArgs e) { SampleBadMethod1(); SampleBadMethod2(); } private void SampleBadMethod1() { for ( int i = 0; i < 100; i++) { SampleBadSubMethod1(); } } private void SampleBadSubMethod1() { Thread.Sleep(10); } private void SampleBadMethod2() { for ( int i = 0; i < 10000; i++) { SampleBadSubMethod2(); } } private void SampleBadSubMethod2() { Thread.Sleep(1); } } * This source code was highlighted with Source Code Highlighter .public partial class Default : System.Web.UI. Page { protected void Page_Load( object sender, EventArgs e) { SampleBadMethod1(); SampleBadMethod2(); } private void SampleBadMethod1() { for ( int i = 0; i < 100; i++) { SampleBadSubMethod1(); } } private void SampleBadSubMethod1() { Thread.Sleep(10); } private void SampleBadMethod2() { for ( int i = 0; i < 10000; i++) { SampleBadSubMethod2(); } } private void SampleBadSubMethod2() { Thread.Sleep(1); } } * This source code was highlighted with Source Code Highlighter .public partial class Default : System.Web.UI. Page { protected void Page_Load( object sender, EventArgs e) { SampleBadMethod1(); SampleBadMethod2(); } private void SampleBadMethod1() { for ( int i = 0; i < 100; i++) { SampleBadSubMethod1(); } } private void SampleBadSubMethod1() { Thread.Sleep(10); } private void SampleBadMethod2() { for ( int i = 0; i < 10000; i++) { SampleBadSubMethod2(); } } private void SampleBadSubMethod2() { Thread.Sleep(1); } } * This source code was highlighted with Source Code Highlighter .public partial class Default : System.Web.UI. Page { protected void Page_Load( object sender, EventArgs e) { SampleBadMethod1(); SampleBadMethod2(); } private void SampleBadMethod1() { for ( int i = 0; i < 100; i++) { SampleBadSubMethod1(); } } private void SampleBadSubMethod1() { Thread.Sleep(10); } private void SampleBadMethod2() { for ( int i = 0; i < 10000; i++) { SampleBadSubMethod2(); } } private void SampleBadSubMethod2() { Thread.Sleep(1); } } * This source code was highlighted with Source Code Highlighter .public partial class Default : System.Web.UI. Page { protected void Page_Load( object sender, EventArgs e) { SampleBadMethod1(); SampleBadMethod2(); } private void SampleBadMethod1() { for ( int i = 0; i < 100; i++) { SampleBadSubMethod1(); } } private void SampleBadSubMethod1() { Thread.Sleep(10); } private void SampleBadMethod2() { for ( int i = 0; i < 10000; i++) { SampleBadSubMethod2(); } } private void SampleBadSubMethod2() { Thread.Sleep(1); } } * This source code was highlighted with Source Code Highlighter .public partial class Default : System.Web.UI. Page { protected void Page_Load( object sender, EventArgs e) { SampleBadMethod1(); SampleBadMethod2(); } private void SampleBadMethod1() { for ( int i = 0; i < 100; i++) { SampleBadSubMethod1(); } } private void SampleBadSubMethod1() { Thread.Sleep(10); } private void SampleBadMethod2() { for ( int i = 0; i < 10000; i++) { SampleBadSubMethod2(); } } private void SampleBadSubMethod2() { Thread.Sleep(1); } } * This source code was highlighted with Source Code Highlighter .public partial class Default : System.Web.UI. Page { protected void Page_Load( object sender, EventArgs e) { SampleBadMethod1(); SampleBadMethod2(); } private void SampleBadMethod1() { for ( int i = 0; i < 100; i++) { SampleBadSubMethod1(); } } private void SampleBadSubMethod1() { Thread.Sleep(10); } private void SampleBadMethod2() { for ( int i = 0; i < 10000; i++) { SampleBadSubMethod2(); } } private void SampleBadSubMethod2() { Thread.Sleep(1); } } * This source code was highlighted with Source Code Highlighter .public partial class Default : System.Web.UI. Page { protected void Page_Load( object sender, EventArgs e) { SampleBadMethod1(); SampleBadMethod2(); } private void SampleBadMethod1() { for ( int i = 0; i < 100; i++) { SampleBadSubMethod1(); } } private void SampleBadSubMethod1() { Thread.Sleep(10); } private void SampleBadMethod2() { for ( int i = 0; i < 10000; i++) { SampleBadSubMethod2(); } } private void SampleBadSubMethod2() { Thread.Sleep(1); } } * This source code was highlighted with Source Code Highlighter .public partial class Default : System.Web.UI. Page { protected void Page_Load( object sender, EventArgs e) { SampleBadMethod1(); SampleBadMethod2(); } private void SampleBadMethod1() { for ( int i = 0; i < 100; i++) { SampleBadSubMethod1(); } } private void SampleBadSubMethod1() { Thread.Sleep(10); } private void SampleBadMethod2() { for ( int i = 0; i < 10000; i++) { SampleBadSubMethod2(); } } private void SampleBadSubMethod2() { Thread.Sleep(1); } } * This source code was highlighted with Source Code Highlighter .public partial class Default : System.Web.UI. Page { protected void Page_Load( object sender, EventArgs e) { SampleBadMethod1(); SampleBadMethod2(); } private void SampleBadMethod1() { for ( int i = 0; i < 100; i++) { SampleBadSubMethod1(); } } private void SampleBadSubMethod1() { Thread.Sleep(10); } private void SampleBadMethod2() { for ( int i = 0; i < 10000; i++) { SampleBadSubMethod2(); } } private void SampleBadSubMethod2() { Thread.Sleep(1); } } * This source code was highlighted with Source Code Highlighter .public partial class Default : System.Web.UI. Page { protected void Page_Load( object sender, EventArgs e) { SampleBadMethod1(); SampleBadMethod2(); } private void SampleBadMethod1() { for ( int i = 0; i < 100; i++) { SampleBadSubMethod1(); } } private void SampleBadSubMethod1() { Thread.Sleep(10); } private void SampleBadMethod2() { for ( int i = 0; i < 10000; i++) { SampleBadSubMethod2(); } } private void SampleBadSubMethod2() { Thread.Sleep(1); } } * This source code was highlighted with Source Code Highlighter .public partial class Default : System.Web.UI. Page { protected void Page_Load( object sender, EventArgs e) { SampleBadMethod1(); SampleBadMethod2(); } private void SampleBadMethod1() { for ( int i = 0; i < 100; i++) { SampleBadSubMethod1(); } } private void SampleBadSubMethod1() { Thread.Sleep(10); } private void SampleBadMethod2() { for ( int i = 0; i < 10000; i++) { SampleBadSubMethod2(); } } private void SampleBadSubMethod2() { Thread.Sleep(1); } } * This source code was highlighted with Source Code Highlighter .public partial class Default : System.Web.UI. Page { protected void Page_Load( object sender, EventArgs e) { SampleBadMethod1(); SampleBadMethod2(); } private void SampleBadMethod1() { for ( int i = 0; i < 100; i++) { SampleBadSubMethod1(); } } private void SampleBadSubMethod1() { Thread.Sleep(10); } private void SampleBadMethod2() { for ( int i = 0; i < 10000; i++) { SampleBadSubMethod2(); } } private void SampleBadSubMethod2() { Thread.Sleep(1); } } * This source code was highlighted with Source Code Highlighter .public partial class Default : System.Web.UI. Page { protected void Page_Load( object sender, EventArgs e) { SampleBadMethod1(); SampleBadMethod2(); } private void SampleBadMethod1() { for ( int i = 0; i < 100; i++) { SampleBadSubMethod1(); } } private void SampleBadSubMethod1() { Thread.Sleep(10); } private void SampleBadMethod2() { for ( int i = 0; i < 10000; i++) { SampleBadSubMethod2(); } } private void SampleBadSubMethod2() { Thread.Sleep(1); } } * This source code was highlighted with Source Code Highlighter .
A small lyrical digression. At first I wanted to choose a real application for profiling. The choice fell on Tailspin Spyworks , which is used as a steb-by-step guide. It would seem that the guide for newbies should be so polished to immediately interest the developer, to teach some right things. And what did I see there? A curved layout, a mix of business logic and markup, non-optimal queries to the database, select * even if 1-2 fields are stretched ... It was very difficult to perform all optimizations 4 times (for 4 profilers), so for 3 minutes it was written used in tests attachment. If anyone is interested, in future articles it will be possible to disassemble by bone Tailspin Spyworks.
')
Pretty lyrics, run profilers.
Visual Studio Performance Profiler
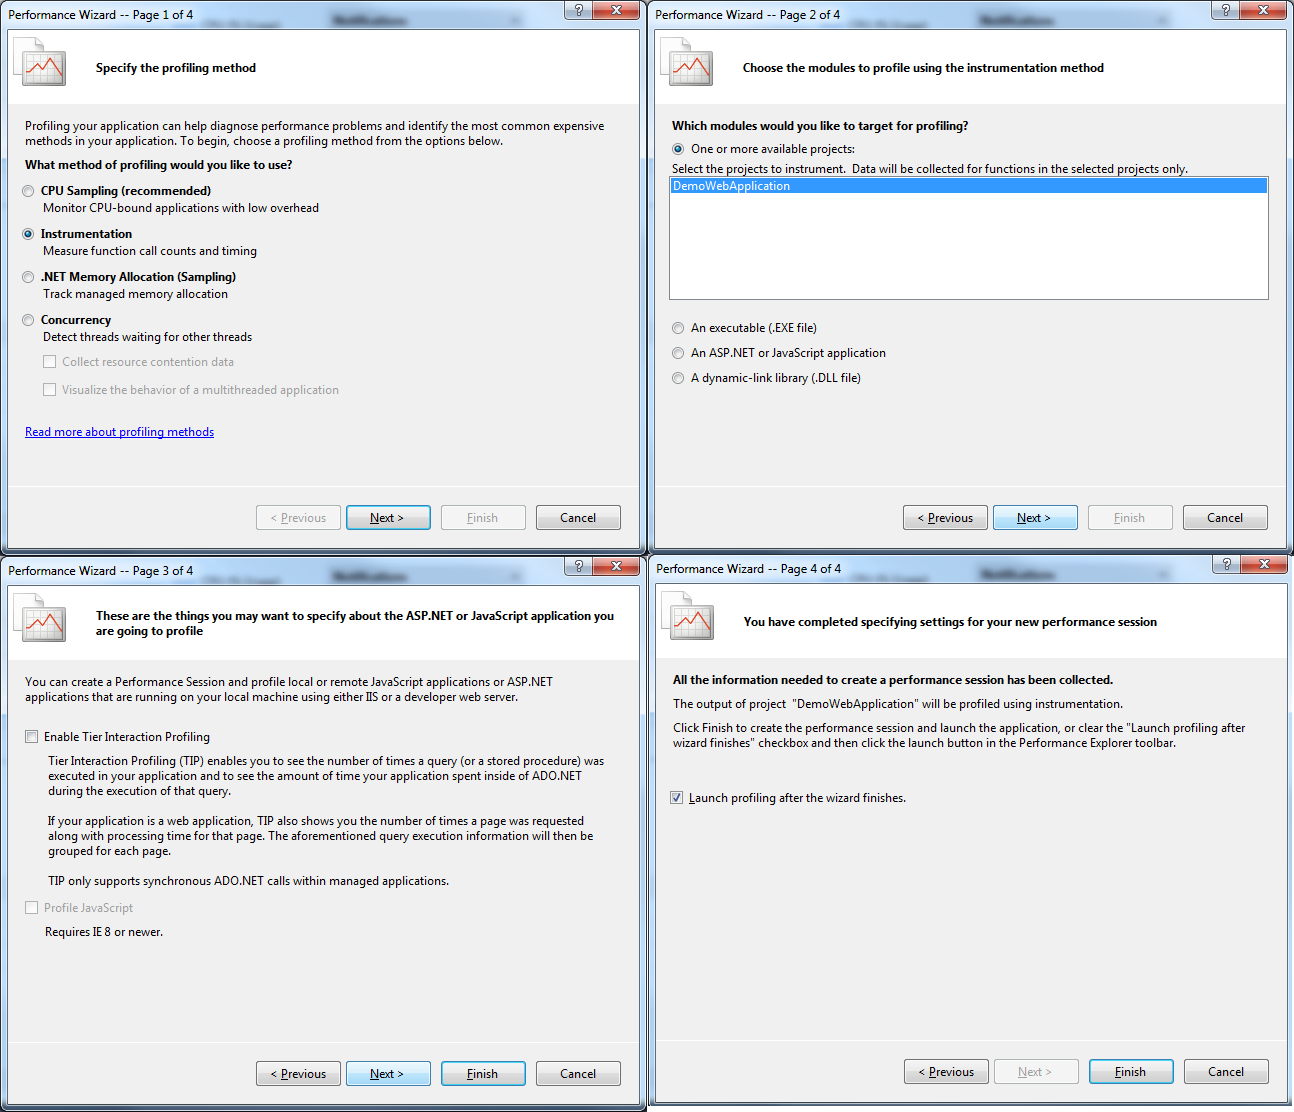
The launch is done from VS through the menu Analyze -> Launch Perfomance Wizard.
With a few simple steps, we select the type of profiling (I chose Instrumentation, because CPU sampling does not show the execution time, only in percents), the projects under study and whether it is necessary to profile database queries through ADO.NET.
After clicking the Finish button, the browser is launched, while in the studio there will be a splash screen with the Pause and Stop buttons.
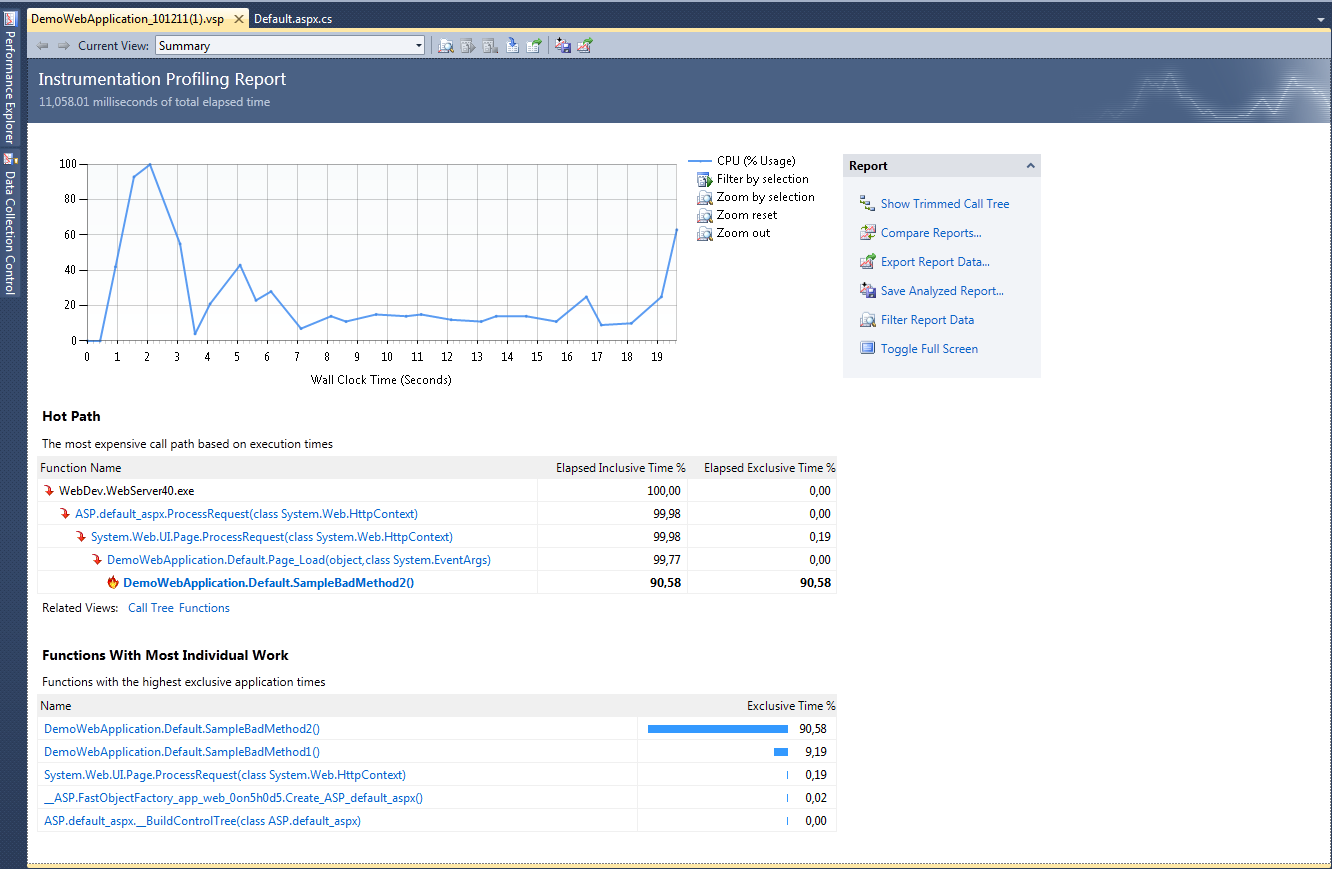
After the page has finished loading in the browser, click Stop and get the result:
We will not dwell on the profiler description; it is done quite well here , here and here .
Here is the statistics screen for the methods:
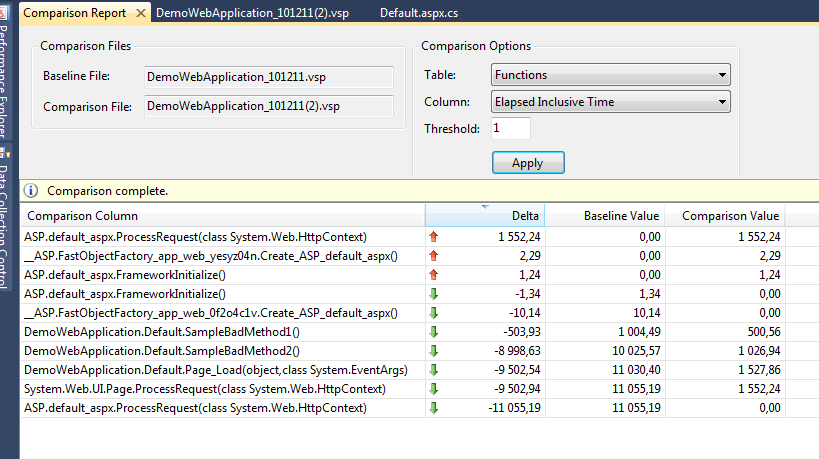
Now you need to optimize the critical parts of the code SampleBadMethod1 and SampleBadMethod2. As an “optimization”, we reduce the number of iterations in a cycle (for example, from 100 to 50 and from 10,000 to 1,000).
Once again we get the result and through the menu item Analyze-> Compare Performance Reports we compare the result:
Well, we are great, we managed to speed up our application.
Repeat the same actions with other profilers.
ANTS Profiler
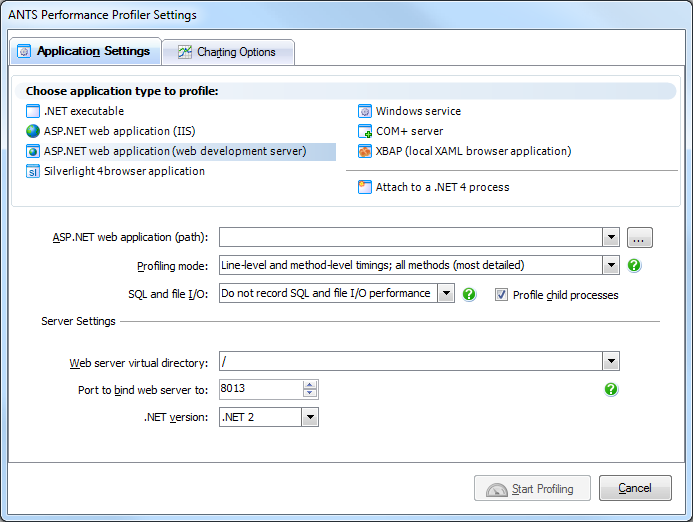
When creating a new profiling session, the following window appears:
Here you can select the type of application, profiling options and enter application data, for example, for an ASP.NET application on a dev server, the path to the application, the .net version, the port number, etc.
After clicking the Start Profiling button, the browser is started, at this time the ANTS Profiler draws a graph of the processor load on the time axis.
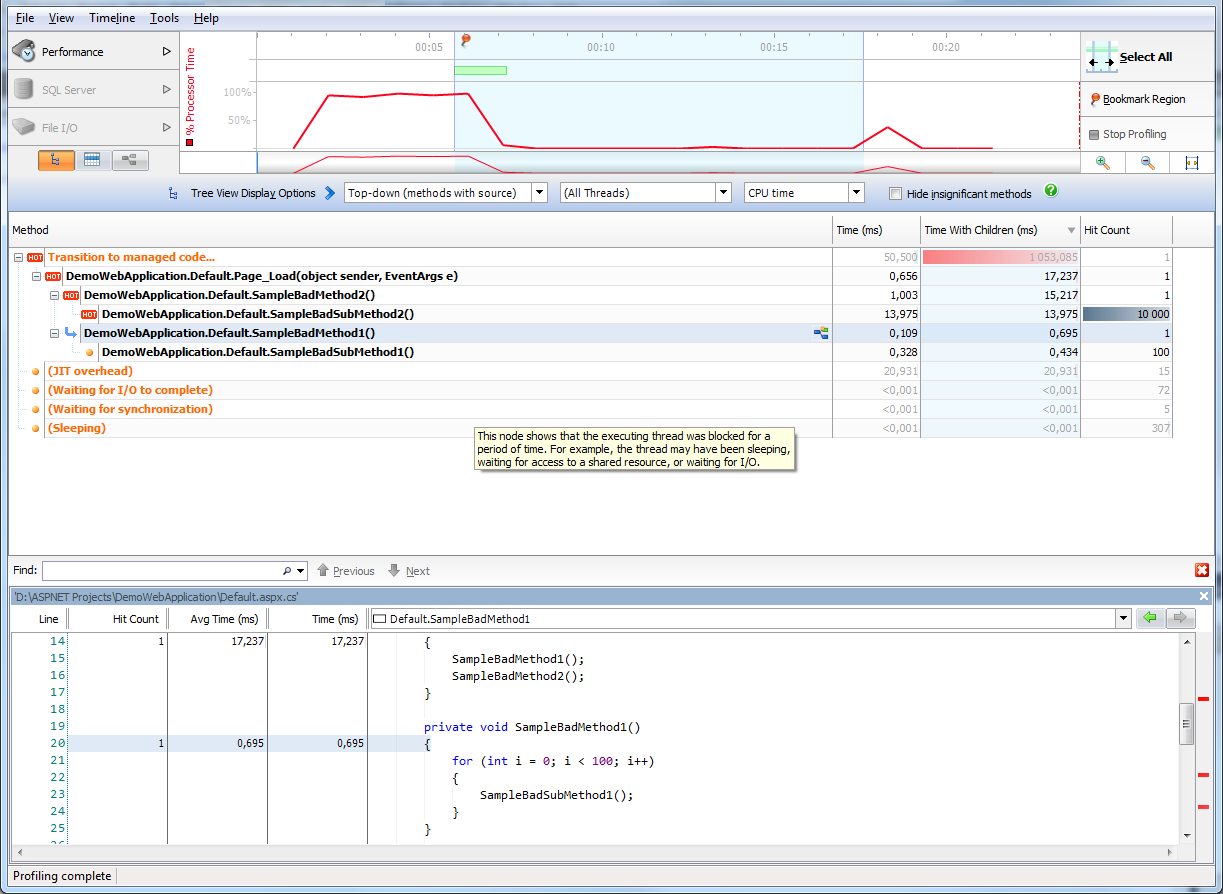
Press the Stop Profiling button and get the result:
I will not consider in detail the purpose and functions of the screen areas (this is the topic of a separate article), I’ll briefly say that you can see the timeline with CPU usage (or any other indicator that you can choose yourself) in the upper part, in the center of the tree with execution statistics by time and number of calls, at the bottom, viewing the source code of the methods (if the code is available).
There is some oddity here: we see that the total execution time of the SampleBadSubMethod2 method is 14 ms, although there is a delay of 1 ms inside it and it is called 10,000 times. Perhaps ANTS somehow incorrectly handles the Thread.Sleep method.
Now we “optimize” the application again, run the profiler, get the result and ... cannot compare using ANTS ... The FAQ on the site suggests starting another profiler and switching between them, comparing the result. Well, thank you, what else to say :)
Enters the battle
dotTrace
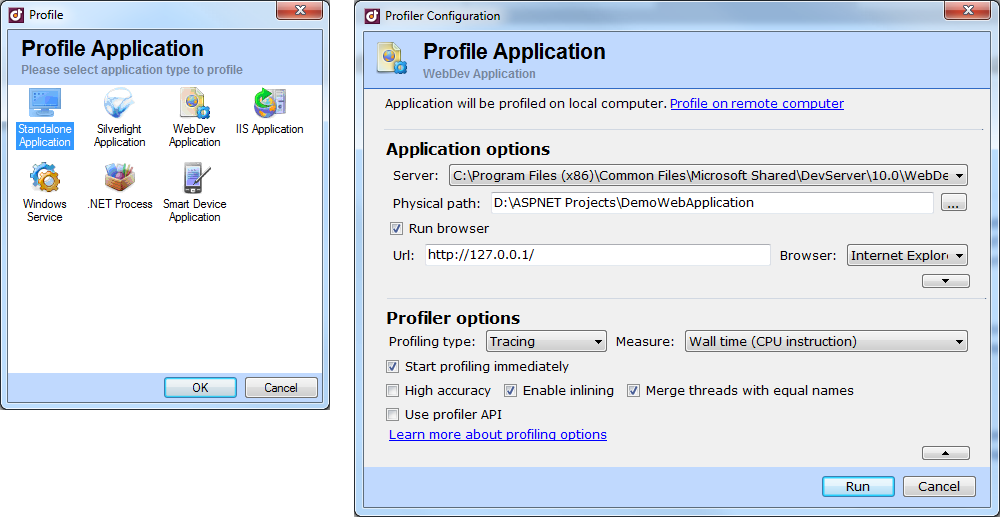
When you select File-> Profile window appears:
Select the type of application, set the settings and Run!
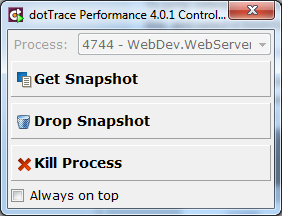
After starting the profiling, a small window appears with which you can get a result (Get Snapshot) or complete the profiling.
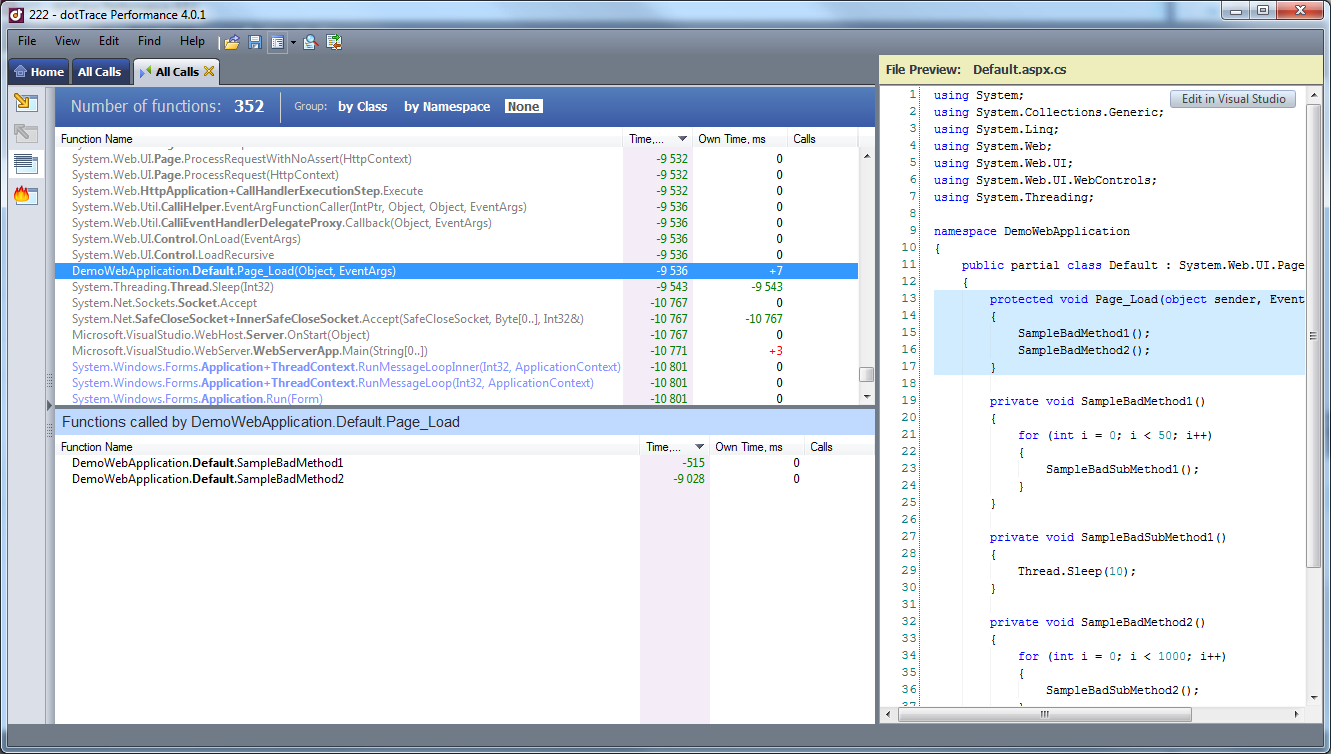
After receiving the result we will see the following window:
Here we see a tree of methods with percentages and runtime. In the right part you can see the source of one or another method.
We optimize the application, get the result and compare it with the original:
Well, the optimization was a success.
And finally
EQATEC Profiler
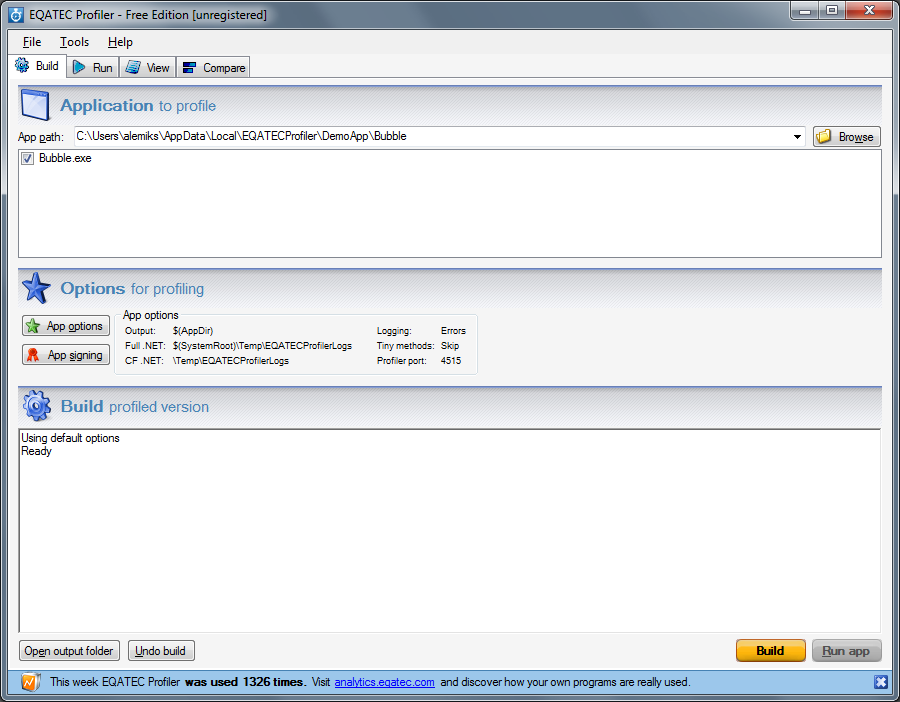
Run profiler, see the window:
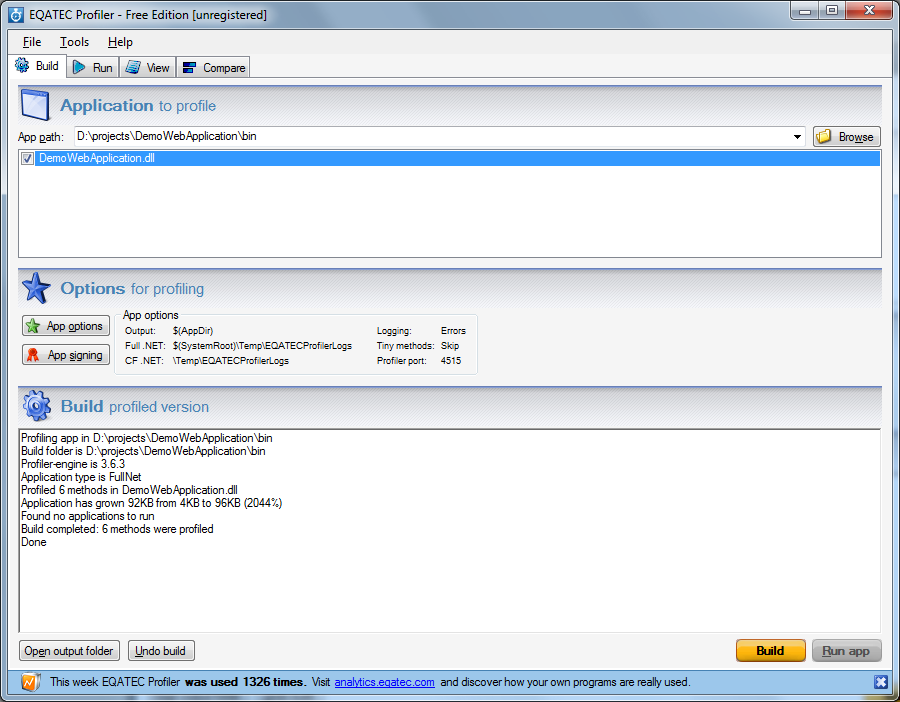
Here you need to choose the path to the bin folder of the application, select the assemblies that you want to explore, click Build.
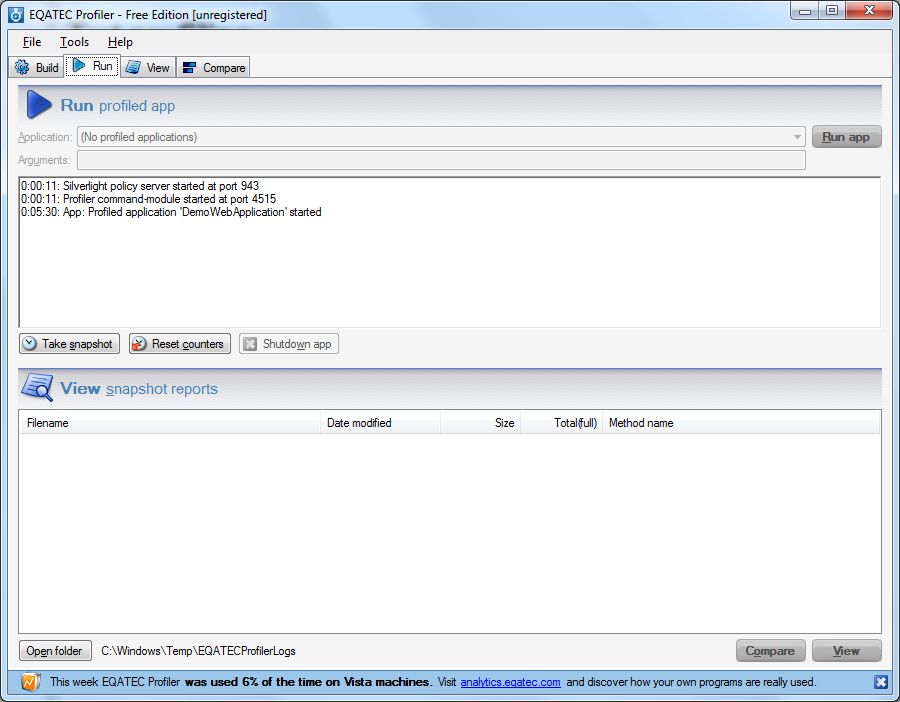
Then launch your favorite browser and load the application page. If everything is fine, then the message Profiled appication xxx started appears in the log and the Take snapshot and Reset counters buttons become active.
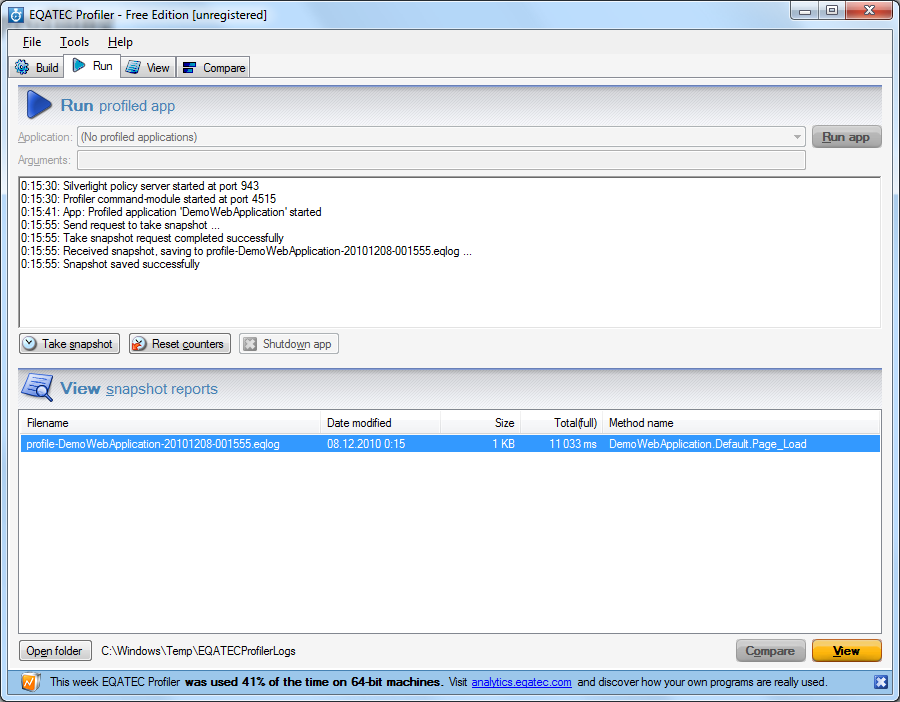
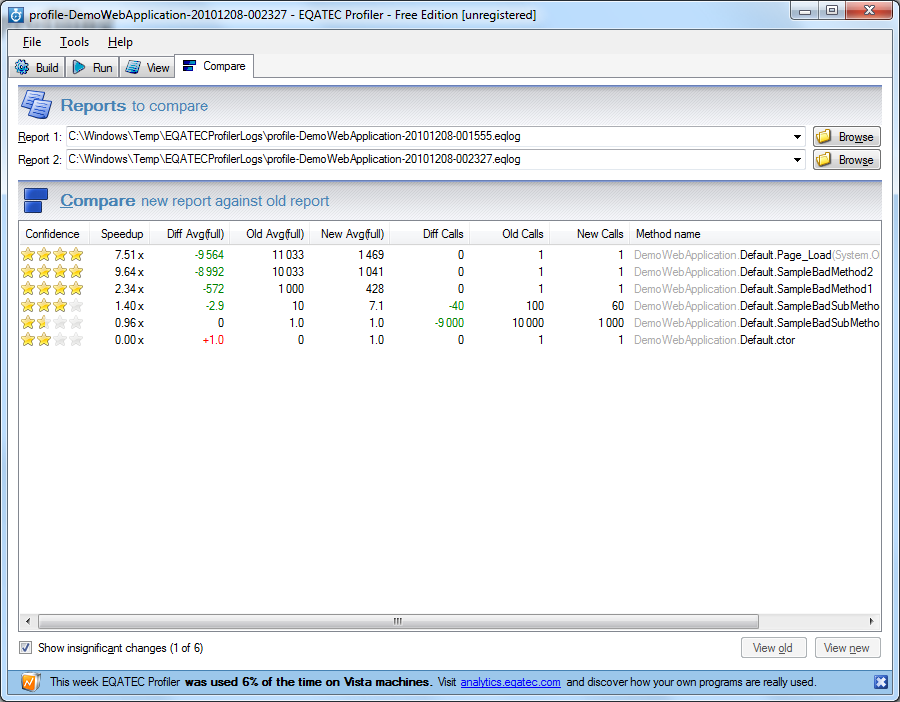
Next, click "Take snapshot":
And here is our snapshot:
We see call statistics, as well as the presentation of methods as blocks (at the bottom). These blocks are clickable, i.e. You can navigate the call up / down hierarchy.
Now once again we optimize the application and compare the result:
We did a great job again, sped up the application many times.
That's all, look at the summary table of possibilities presented by profilers
Summary
| VS Profiler | ANTS | dotTrace | EQATEC | |
|---|---|---|---|---|
| Showing relative results of executing methods (in%) |  | | | |
| Show absolute results of executing methods (in seconds, ms, etc.) | | | | |
| Show the number of method calls | | | | |
| View source methods | | | |  |
| Comparison of the results of two measurements | | | | |
| Price | > 5000 $ 1) | from $ 395 2) | from $ 199 3) | free 4) |
1) as part of VS Premium and above
2) depends on the wording
3) free for open source projects
4) limitation on 10 simultaneously loaded dll, for $ with less restrictions
Now we will consider the advantages and disadvantages I have noticed for each profiler separately, not indicated in the comparative table.
VS Profiler
built into VS (true to premium and ultimate) interaction with ADO.NET capricious, sometimes profiling doesn't start without explanation The appSettings section should be in the web.config, and not in a separate file, because some service settings are written there, and the developers apparently did not provide for the location of this section in an external file on a big project and a not very powerful machine, it slows down noticeablyANTS Profiler
most detailed information on method calls, a bunch of performance counters in the profile mode, SQL thinks that besides ./SQLEXPRESS servers no longer exist :) no comparison of two measurement resultsdotTrace
most liked the documentation in the tree view mode, some kind of a mess of numbers, method names, assemblies It did not start in IIS Application mode, although I did everything according to good documentation.EQATEC
small and fast, suitable if you do not need to look at performance line by line and do not need source This minus is a consequence of a plus: less than other competitors have.So, I will make, perhaps, a subjective conclusion. My choice is EQATEC Profiler, for many tasks it’s more than enough performance evaluation. If you can use VS Premium or Ultimate, the built-in profiler is a pretty good product. In this case, the need to purchase other profilers will disappear. Of the remaining two profilers, the ANTS profiler is striking in its power, although it is not clear why there is no comparison of the results. DotTrace has an abundance of purchase options with a lot of features of the profiler itself.
Thank you for reading this review! I hope he helps you make a choice.
PS Suggestions for a detailed review of each profiler are accepted.
Source: https://habr.com/ru/post/109418/
All Articles