We check the site resiliency
 This is another post of their already traditional New Year's Eve series about checking the site resiliency and its readiness to accept all your visitors, puzzled by the choice of gifts or pre-New Year discounts. In this release, I will discuss the creation of tests in the advanced mode using the recording of actions (Proxy recorder), which allows you to almost completely emulate the behavior of real users from a real browser on your site. Also, the topic of analysis of the graphs on fault tolerance will be touched on a bit.
So let's go.
It will be about using the Load Impact service. First we need to start the test itself.
Creating a test
 Most of the described features of the service are available only after registration, but if you just need to check how the site behaves under load, you can set the site address directly on the main page . And then see how you can interpret the graphics (about this at the end of the article). If you are interested in a more detailed and accurate assessment, then you should still register.
Proxy recorder is available in
Advanced mode -> Load script generation -> Record session . Here you can specify a set of HTTP requests to emulate any visits to your site and any number of simultaneous visitors. Very handy tool. To use it, you only need to set the appropriate settings in your browser.')
About the settings.
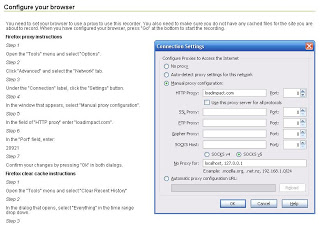 At the beginning of the recording, a prompt is displayed on the proxy settings (apparently, with a ready-made screenshot for the current browser). This allows you to actually drive all the necessary parameters in a minute. The only thing worth paying special attention to is the port. For each new use, it is created separately, and separately checked.
When using a proxy, it becomes possible to test all dynamic and AJAX requests: when they enter a site visit, they are simply recorded, and then become available in the appropriate field when creating a test ...
 But before using a proxy, it is worth checking that everything is configured correctly. Otherwise, you will have to record the entire test script again.
Finally, the last step in the formation of the test is the choice of limits for users and the step of increasing load.
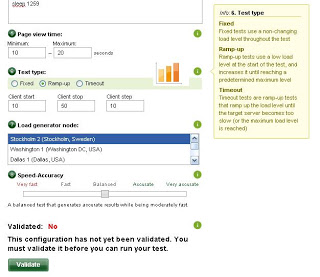 For small sites, as I mentioned above, 50 simultaneous visits are enough. Already on these numbers it will be clear whether the site is ready for at least some load or not.
For simple testing of site resiliency, you can set a limit in the region of 500-1000 users in 100 increments. This will give a completely sane picture of the site's behavior under load, but it will greatly reduce both testing time and traffic limits.
In case you need a detailed picture, you will have to set a step of 10-20 users. This ensures that the testing will be as accurate as possible and that you will receive a true estimate of the site's power.
After all the parameters are set, you can confirm the test (for users less than 500 - the usual formal, then you will need to have the file loadimpact.txt with your login in the root of the site). Also, when saving the settings, a test run is performed to see if everything is set correctly.
Run the test
Now the fun part. After we spent a few (tens) minutes to set up the test, it's time to start it. Testing itself can take up to several hours (if many steps), and in general it is better to conduct it during the period of the least user activity (for example, at night). After the end of the test, you will get a lot of plots, let's look at them.
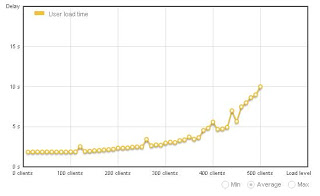
 The main graphs are server response time (user load time) and total load time (accumulated user time). The last parameter may have little to do with the actual load time of the site under load (since the main servers are located in Sweden), but the dynamics will be shown absolutely exactly.
Server response time reflects server overhead for creating an HTML document with an appropriate number of simultaneous visits to the site. The critical point here will be in 10-15 seconds, when up to 80% of users will start to simply leave the site without waiting for it to load. Also, with the appropriate server settings, time-out errors may be generated (nginx, for example).
For good sites, the fault tolerance schedule resembles an exponent (as in the example above), which crosses a value of 10 seconds 3-5 times farther than the current peak load. This means that with a sharp increase in the number of visitors, your site, in principle, will withstand the load.
The situation is worse if the schedule goes up sharply even with an increase in the number of visitors by 2 times (or even at the current peak value). In this case, it is necessary to take optimizing actions, and urgently.
But it is quite good when at any (tested) load the schedule will be straight (with small deviations). This means that the strength margin of the site is very good.
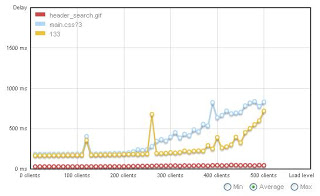 Also in the test results you can compare several different resources (HTTP requests) in order to find the narrowest point (sometimes it can even be dynamic images that consume too much server time). In this case, even with a quick return of the HTML document, the site will load slowly. But almost always the main problems are in the speed of creating an HTML page.
Summary
Load Impact is a unique tool for load testing, and at the same time allows you to independently set any scenarios for user behavior and check how ready the site is for them. At the same time, most of the information is available free of charge for testing up to 50 users.
I hope this article will help prepare your sites for the New Year boom :)
Source: https://habr.com/ru/post/109247/
All Articles