Process Explorer. Overview of some features
Process Explorer is an alternative to the standard Task Manager. This utility, like many other utilities of Sysinternals , greatly enhances the control and management of the system. The main innovation of the 14th version just released is the ability to monitor network activity of processes. Then a brief overview of the features of this utility, which I consider most useful for myself.
For reference. Since 2006, Sysinternals was acquired by Microsoft, and the key figure of this company, Mark Russinovich , has since been working for Microsoft. Mark is known for his utilities, the Windows Internals book, blog and is a recognized Windows architecture specialist.
Content:
')
For each process:
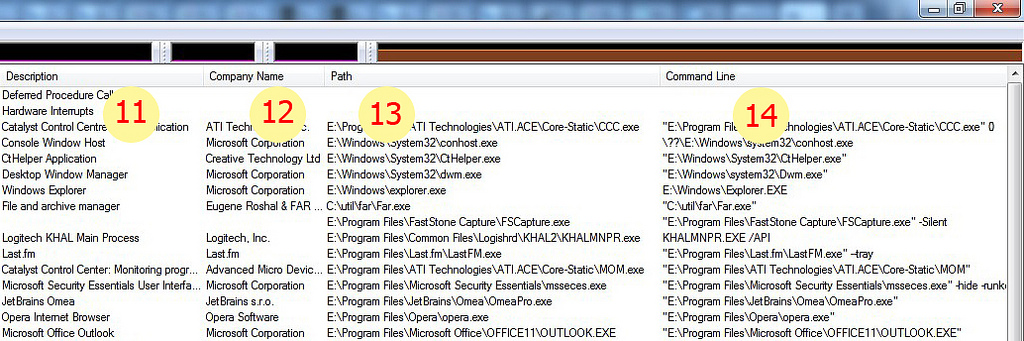
When you hover the cursor over svchost (a process that hosts services in itself), you can see a list of services - a rather useful feature.
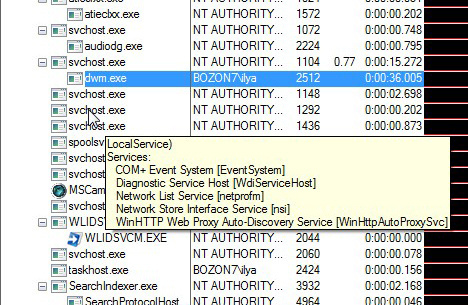
At the top of the main window there are graphs of the main summary parameters - memory, disk, network and CPU activity. When you move the cursor through the history of the parameter, the process that gave the maximum contribution to this value at a given time is shown. In addition, the tooltip contains information about the instantaneous value of the parameter (depending on the refresh rate). The following picture is a graph of network activity.
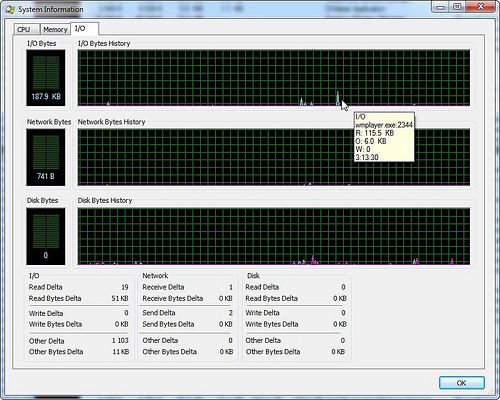
In the “system information” window, the graphs are gathered together, it is more convenient to look at the correlation of parameters.
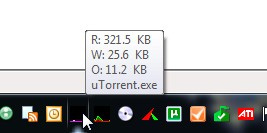
A very handy feature - removal of icons with graphs of total activity to the tray. There may be disk activity graphics, CPU and memory. I use the first two - I glance there, if you have questions, just move the cursor and find out which process gives the maximum contribution to the parameter. Unfortunately, network activity cannot be set there, I hope it is a matter of time.
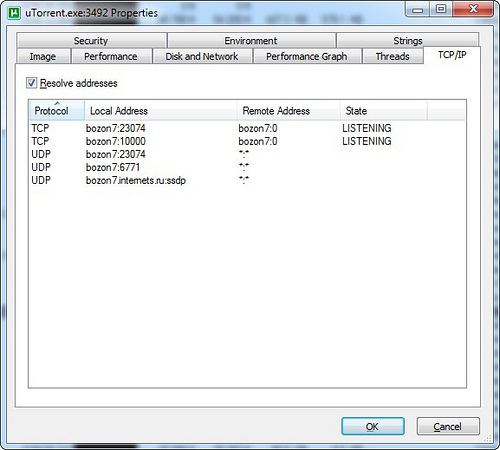
In the properties of the process in the TCP / IP tab, you can see the current active connections. Unfortunately, network activity is not visible on them, this functionality is still available in another utility - tcpview .
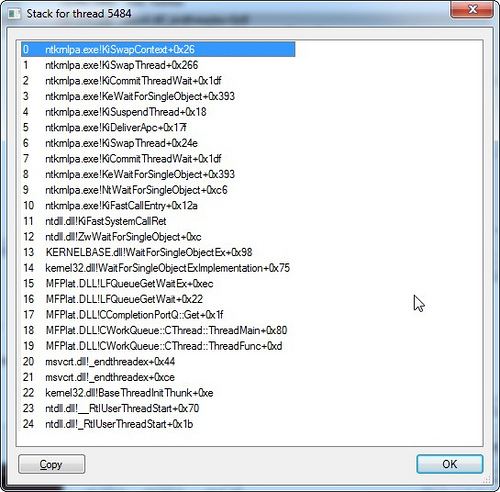
In the properties of the process in the threads tab, you can see all its threads and CPU load by threads. Suppose you want to consider the stack of a thread that is intensively doing something or hanging. To do this, you first need to recognize it, say, by loading the CPU, then it is useful to suspend the process in order to calmly examine its state — this can be done right in this window using the “suspend” button. Next, select the thread and click “stack”. In most cases, the stack will begin in the depths of the system and terminate in an incomprehensible way. The fact is that without having debugging information on the system libraries, it will not be possible to deploy the stack correctly and figure it out. There is a solution - you need to configure access with symbolic information from the Microsoft site. There are several steps to do:

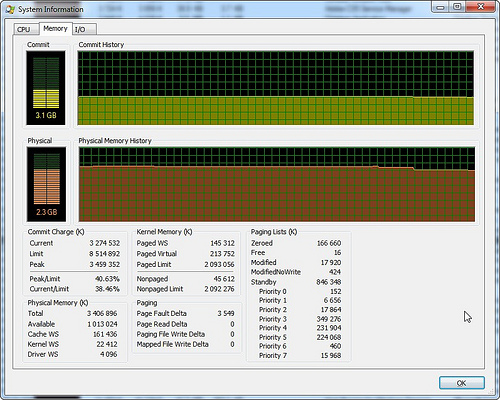
In the window “system information” tab “memory”. There are two graphics - commit and physical. Physical - the use of physical memory without regard to the file cache, under which all that remains goes. Commit - how much memory is allocated for processes including the used virtual memory. Under the graphs in the “Commit Charge” section there are Limit and Peak fields. Limit is determined by the sum of physical and virtual memory, i.e. This is the maximum total amount of memory that the system can allocate. Peak is the maximum of the Commit schedule during the operation of the utility. The Current / Limit and Peak / Limit percentage ratios are convenient for quickly assessing how much the state of the system approached the critical limit for available memory.
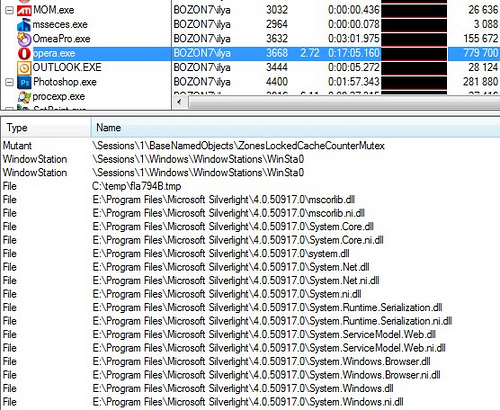
In the main window, you can turn on the delimiter and display the selected process's DLL or handles from below. When dealing with viruses and debugging programs, this can be very useful. In the picture there is a handles list for opera, the first file system handle is a flash movie in the temporary directory.
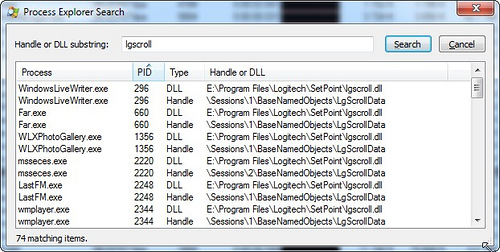
For a DLL, you can add a column with a full path to the image, sort by it, analyze whether there are any suspicious modules. The picture shows that the module is connected from Logitech, there is a suspicion that this is something like a hook that is being introduced into all processes. The next item will see where it is still found.

Search by handle or DLL name in all processes. Enter the name of the DLL from Logitech from the previous paragraph and make sure that it is connected almost everywhere.
Another example - you need to understand who is blocking a file or working with a folder. We enter part of the path and find all the processes that have discovered similar objects of the system. You can click on an element from the list and go to the process, and the corresponding handle or DLL will be highlighted.

PS To display some fields (for example, network statistics) administrative privileges are required. You can increase privileges in an already running Process Explorer using the command in the File menu. Only in the presence of such privileges is it possible to add such columns. I think this behavior is wrong, because hides the potential of the application from the user. If the fields are added and there are no administrative rights on the next launch, they will be empty. You can set the "/ e" key in the command line to force elevation of privileges when starting Process Explorer.
For reference. Since 2006, Sysinternals was acquired by Microsoft, and the key figure of this company, Mark Russinovich , has since been working for Microsoft. Mark is known for his utilities, the Windows Internals book, blog and is a recognized Windows architecture specialist.
Content:
- The columns in the main window
- Services inside svchost
- Total activity graphs, process with maximum activity
- Total tray activity graphs, process with maximum activity
- Process network connections
- Process threads, their activity, character stack
- System Memory Information
- Handles and process DLLs
- Search handles and dll
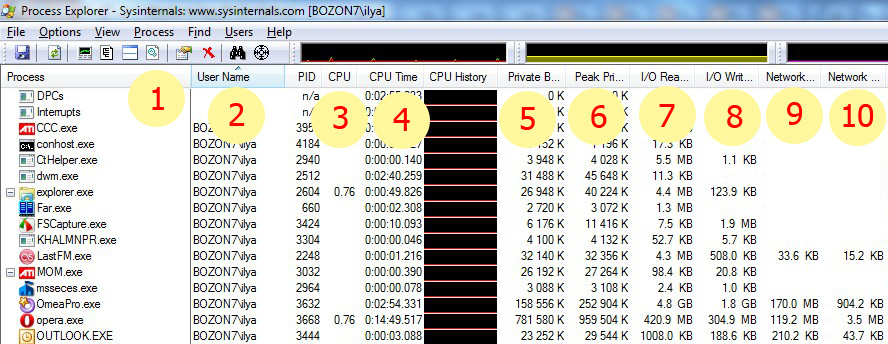
The columns in the main window
')
For each process:
- Process name
- The owner of the process, I use sorting by this field, so that user processes go first, then system
- CPU loading process
- The total elapsed time of the CPU, it is interesting sometimes to pay attention to it, useful for timing
- Private bytes - the amount of memory occupied by the process (actually allocated pages, excluding shared)
- Peak private bytes - the peak value of Private bytes, it is sometimes interesting to see how it came
- I / O read bytes - the total amount of data read from the disk, the change shows activity
- I / O write bytes - the total amount of data written to disk, the change shows activity
- Network receive bytes - the total amount of data read from the network, the change shows activity
- Network send bytes - the total amount of data transmitted to the network, the change shows activity
- Process description
- Company name
- Full path to the process image (here you can understand exactly where the process started from)
- Command line process start
Services inside svchost
When you hover the cursor over svchost (a process that hosts services in itself), you can see a list of services - a rather useful feature.
Total activity graphs, process with maximum activity
At the top of the main window there are graphs of the main summary parameters - memory, disk, network and CPU activity. When you move the cursor through the history of the parameter, the process that gave the maximum contribution to this value at a given time is shown. In addition, the tooltip contains information about the instantaneous value of the parameter (depending on the refresh rate). The following picture is a graph of network activity.
In the “system information” window, the graphs are gathered together, it is more convenient to look at the correlation of parameters.
Total tray activity graphs, process with maximum activity
A very handy feature - removal of icons with graphs of total activity to the tray. There may be disk activity graphics, CPU and memory. I use the first two - I glance there, if you have questions, just move the cursor and find out which process gives the maximum contribution to the parameter. Unfortunately, network activity cannot be set there, I hope it is a matter of time.
Process network connections
In the properties of the process in the TCP / IP tab, you can see the current active connections. Unfortunately, network activity is not visible on them, this functionality is still available in another utility - tcpview .
Process threads, their activity, character stack
In the properties of the process in the threads tab, you can see all its threads and CPU load by threads. Suppose you want to consider the stack of a thread that is intensively doing something or hanging. To do this, you first need to recognize it, say, by loading the CPU, then it is useful to suspend the process in order to calmly examine its state — this can be done right in this window using the “suspend” button. Next, select the thread and click “stack”. In most cases, the stack will begin in the depths of the system and terminate in an incomprehensible way. The fact is that without having debugging information on the system libraries, it will not be possible to deploy the stack correctly and figure it out. There is a solution - you need to configure access with symbolic information from the Microsoft site. There are several steps to do:
- Install Debugging Tools . From the above link, follow the link “Debugging Tools for Windows 32-bit Versions” or “Debugging Tools for Windows 64-bit Versions”. Next, select the latest version that is not integrated into the SDK for downloading, otherwise it will result in downloading a huge amount of SDK, and only a few Mb.
- Configure access to symbols in Process Explorer. Options -> Configure Symbols. In one field we set the path to dbghelp.dll, which is inside the installed product from step 1. In the second, we configure such a tricky line: “srv * C: \ Symbols * http: //msdl.microsoft.com/download/symbols”. Part of the line indicates the local cache for PDB files, the second part of the path to the server for downloading.
- Now the list of threads and the stack will be more informative. When opening these windows, there may be a delay in the paging of PDB files from the Microsoft server, but this is done once for each module version, the result is cached in the selected folder.
System Memory Information
In the window “system information” tab “memory”. There are two graphics - commit and physical. Physical - the use of physical memory without regard to the file cache, under which all that remains goes. Commit - how much memory is allocated for processes including the used virtual memory. Under the graphs in the “Commit Charge” section there are Limit and Peak fields. Limit is determined by the sum of physical and virtual memory, i.e. This is the maximum total amount of memory that the system can allocate. Peak is the maximum of the Commit schedule during the operation of the utility. The Current / Limit and Peak / Limit percentage ratios are convenient for quickly assessing how much the state of the system approached the critical limit for available memory.
Handles and process DLLs
In the main window, you can turn on the delimiter and display the selected process's DLL or handles from below. When dealing with viruses and debugging programs, this can be very useful. In the picture there is a handles list for opera, the first file system handle is a flash movie in the temporary directory.
For a DLL, you can add a column with a full path to the image, sort by it, analyze whether there are any suspicious modules. The picture shows that the module is connected from Logitech, there is a suspicion that this is something like a hook that is being introduced into all processes. The next item will see where it is still found.
Search handles and dll
Search by handle or DLL name in all processes. Enter the name of the DLL from Logitech from the previous paragraph and make sure that it is connected almost everywhere.
Another example - you need to understand who is blocking a file or working with a folder. We enter part of the path and find all the processes that have discovered similar objects of the system. You can click on an element from the list and go to the process, and the corresponding handle or DLL will be highlighted.
PS To display some fields (for example, network statistics) administrative privileges are required. You can increase privileges in an already running Process Explorer using the command in the File menu. Only in the presence of such privileges is it possible to add such columns. I think this behavior is wrong, because hides the potential of the application from the user. If the fields are added and there are no administrative rights on the next launch, they will be empty. You can set the "/ e" key in the command line to force elevation of privileges when starting Process Explorer.
Source: https://habr.com/ru/post/108536/
All Articles