Classification and selection of objects in images
Hello!
In connection with the scope of its activities, I gathered, in my opinion, very valuable material that I want to share with you. I think some of it will be extremely important and useful, perhaps my achievements will save you time, in which case I will be glad. And so to the point. On Habré there is already a good overview of data clustering algorithms . The theory is considered in detail, but there are no practical results, as usual the practice is not as easy as it seems. Therefore, I would like to present to your information the real results, problems and their solutions that arose during clustering (more precisely, to say segmentation, because the clustering object is a static image). Under the cut there will be both segmentation and digital image processing. I beg…
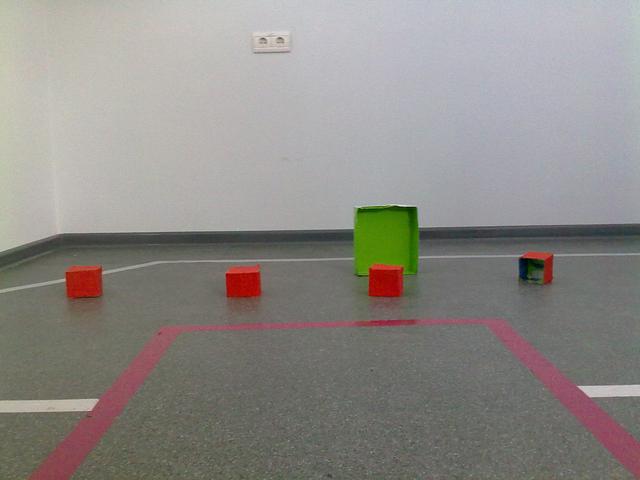
First, a brief statement of the problem, which arose as a subtask for the task of planning a trajectory: there is a static image obtained with the camera of a mobile robot:
')
This image can be considered as an environment with obstacles (scene), which is a collection of objects of different colors and sizes, and it is not known in advance which of the objects is useful (target) and which is an obstacle (disturbance). It is also assumed that each object in the image (obstacles, background and road surface) is described by its colors - the main feature by which it can be classified. So you need to be able to select any of the objects represented in the image.
Let me briefly remind you that data clustering, in general, cluster analysis (data clustering) is the task of partitioning a given sample of objects (situations) into subsets called clusters, so that each cluster consists of similar objects, and objects of different clusters are essentially were different. The task of clustering relates to statistical processing, as well as to a wide class of learning tasks without a teacher. Cluster analysis is a multidimensional statistical procedure that collects data containing information about the selection of objects, and then organizes objects into relatively homogeneous groups (clusters) (Q-clustering, or Q-technique, actually cluster analysis). A cluster is a group of elements characterized by a common property; the main goal of cluster analysis is to find groups of similar objects in a sample.
And why is it even necessary to live without clustering? Also, no one has illuminated, I will try to remove the veil from the purpose of this concept.
In the first case, the number of clusters trying to do smaller. In the second case, it is more important to ensure a high degree of similarity of objects within each cluster, and clusters can be as many as you like. In the third case, the most interesting are the individual objects that do not fit into any of the clusters. In all these cases, hierarchical clustering can be used, when large clusters are broken up into smaller ones, which in turn are split up even smaller, and so on. Such problems are called taxonomy tasks. The taxonomy results in a tree-like hierarchical structure. In addition, each object is characterized by listing all the clusters to which it belongs, usually from large to small. A classic example of the similarity-based taxonomy is the binomial nomenclature of living beings, proposed by Carl Linnaeus in the middle of the 18th century. Similar systematization is built in many areas of knowledge in order to streamline information about a large number of objects.
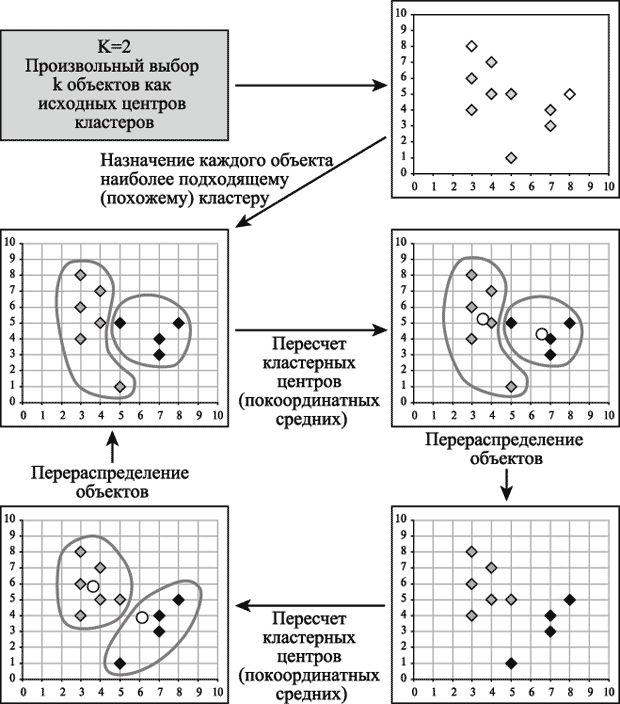
The theory is enough for now, let's return to the problem, now that someone has met the term, someone has refreshed in his head, and who has completely missed, we will solve the problem. The k-means clustering method is used for the solution, because this method does not require preliminary assumptions regarding the number of clusters; in order to be able to use this method, it is necessary to have a hypothesis about the most probable number of clusters. The general idea of the algorithm: a given fixed number of k clusters of observations are compared to clusters so that the averages in the cluster (for all variables) differ as much as possible from each other. For fans of pictures and an attempt to "explain on the fingers" (when the number of clusters is equal to two):
I want to say at once that everything was done in Mathworks’s Matlab math package (the description of the implementation is a separate extensive article). Applying the k-means for the original image given at the beginning, we get the following segmented image:
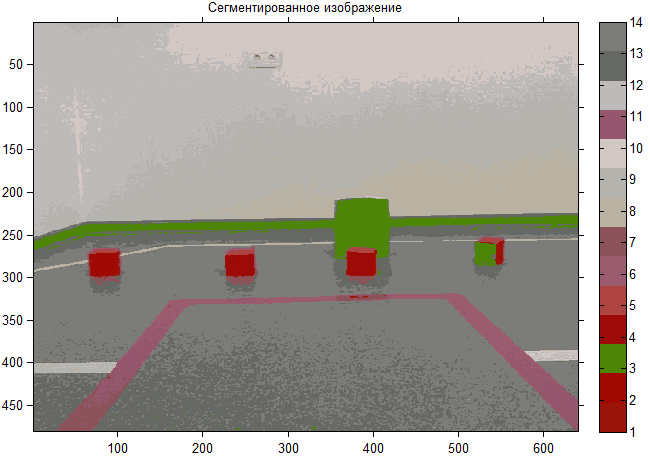
It is seen that most clusters do not have clear boundaries, overlap each other. Comparing the two figures, it is not difficult to notice that atypical objects have appeared (“divorces” on the wall and the floor), which are desirable (rather necessary for a real task) to be assembled into a common cluster. This is due to the fact that the algorithm is too sensitive to outliers, which can distort the average and it is necessary to perform preliminary image processing .
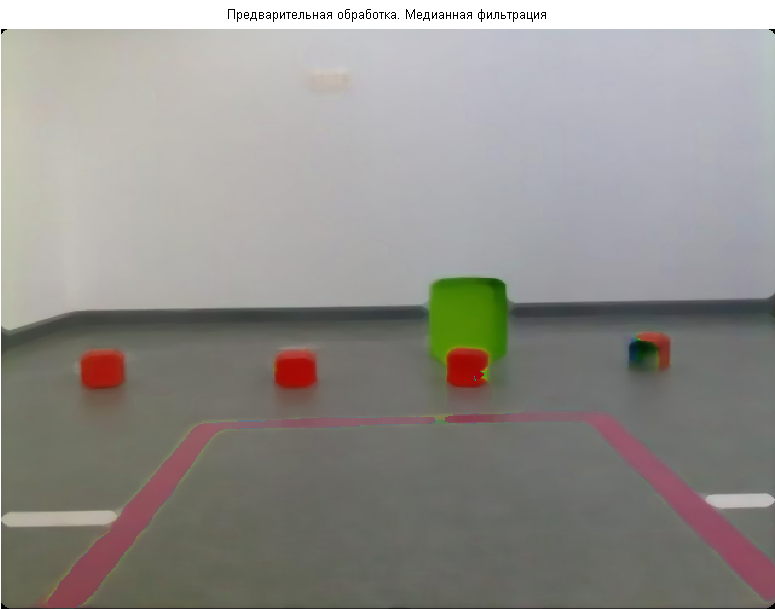
The first thing that came to mind after much deliberation was the median image filtering, which is the solution for effectively removing noise while preserving the details of the image that are important for subsequent recognition. The complexity of solving this problem essentially depends on the nature of the noise. Unlike deterministic distortions, which are described by functional transformations of the original image, models of additive, pulsed and multiplicative noise are used to describe random effects. And now we will smoothly plunge into the theory.
The most common type of interference is random additive noise, which is statistically independent of the signal. The additive noise model is used when the signal at the output of the system or at any stage of the conversion can be considered as the sum of the useful signal and some random signal. The additive noise model describes well the action of film grain, fluctuation noise in radio systems, quantization noise in analog-to-digital converters, etc. Additive Gaussian noise is characterized by adding values to each pixel of the image with a normal distribution and with a zero average value. Such noise usually appears at the stage of digital imaging. The basic information in the images is carried by the contours of the objects. Classic linear filters can effectively remove statistical noise, but the degree of blurring of small details in an image may exceed acceptable values. To solve this problem, nonlinear methods are used, for example, Perron and Malik anisotropic diffusion algorithms, bilateral and trilateral filters. The essence of such methods is to use local estimates that are adequate to the definition of the contour in the image, and to smooth out such areas to the least extent. Impulse noise is characterized by replacing part of the pixels in the image with fixed or random values. In the image, such interference appears as isolated contrast points. Impulse noise is typical for devices for inputting images from a television camera, image transmission systems over radio channels, as well as for digital image transmission and storage systems. To remove impulse noise, a special class of nonlinear filters based on rank statistics is used. The general idea of such filters is to detect the position of a pulse and replace it with an estimated value, while keeping the other pixels of the image unchanged.
Median image filtering is most effective if the noise in the image is pulsed and represents a limited set of peak values against the background of zeros. As a result of the application of the median filter, the slopes and sharp differences in brightness values on the images do not change. This is a very useful property for images in which the contours carry the basic information. When median filtering noisy images, the degree of smoothing of the contours of objects directly depends on the size of the filter aperture and the shape of the mask. With small aperture sizes, contrasting details of the image are better preserved, but pulsed noise is less suppressed. For large sizes of the aperture, the opposite is true. The optimal choice of the shape of the smoothing aperture depends on the specifics of the problem being solved and the shape of the objects. This is of particular importance for the task of preserving differences (sharp brightness limits) in images.
All right, now you can show results
Everything seemed to be fine, but it was decided not to stop at what had been achieved and then almost accidentally stumbled upon a technological method of processing a photographic image, which makes it possible to achieve the effect of feeling more sharp by increasing the contrast of tonal transitions (Unsharp masking). It is important to note that unsharp masking does not really sharpen the image. It cannot restore the image of a part that was lost at different stages of production (during shooting, scanning, resizing, and printing reproduction). Unsharp masking enhances the local image contrast in those areas where abrupt changes in color gradation were originally present. Due to this, the image is visually perceived as sharper.
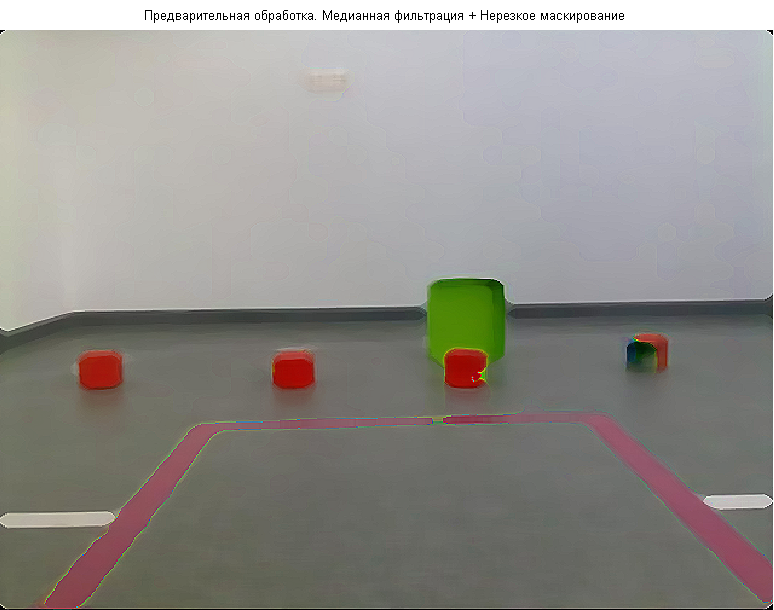
If it is clear, then after the median filtering and unsharp masking there will be such a picture:
Well, now let's perform clustering and compare what was and what has become:
As you can see, the number of clusters immediately decreased and now they have clearer boundaries, we can assume that the problem has been solved, it only remains to offer a tool for selecting an object into an image.
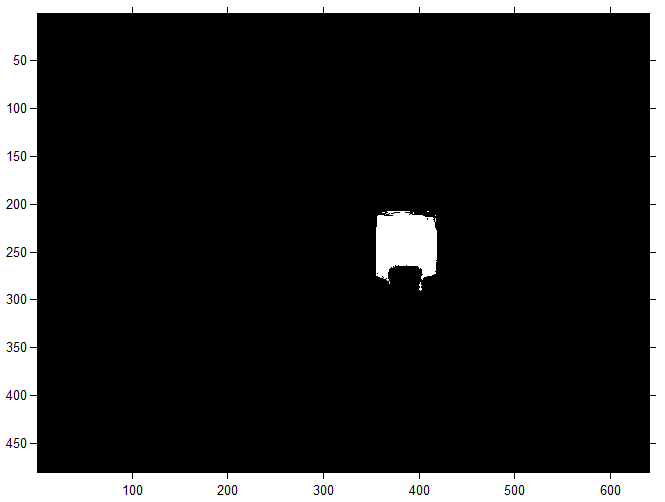
When cluster analysis is performed, you can determine the coordinates of the target object in the image. For this cluster, they are represented by binary images (masks), on which the values of each pixel are conditionally coded (0 - background or background, 1 - foreground), that is, segmentation with the selection of boundaries. For example, the mask of a green object will be
Thank you for your attention, I hope you have been and will be helpful.
In connection with the scope of its activities, I gathered, in my opinion, very valuable material that I want to share with you. I think some of it will be extremely important and useful, perhaps my achievements will save you time, in which case I will be glad. And so to the point. On Habré there is already a good overview of data clustering algorithms . The theory is considered in detail, but there are no practical results, as usual the practice is not as easy as it seems. Therefore, I would like to present to your information the real results, problems and their solutions that arose during clustering (more precisely, to say segmentation, because the clustering object is a static image). Under the cut there will be both segmentation and digital image processing. I beg…
Let's start
First, a brief statement of the problem, which arose as a subtask for the task of planning a trajectory: there is a static image obtained with the camera of a mobile robot:
')
This image can be considered as an environment with obstacles (scene), which is a collection of objects of different colors and sizes, and it is not known in advance which of the objects is useful (target) and which is an obstacle (disturbance). It is also assumed that each object in the image (obstacles, background and road surface) is described by its colors - the main feature by which it can be classified. So you need to be able to select any of the objects represented in the image.
Let me briefly remind you that data clustering, in general, cluster analysis (data clustering) is the task of partitioning a given sample of objects (situations) into subsets called clusters, so that each cluster consists of similar objects, and objects of different clusters are essentially were different. The task of clustering relates to statistical processing, as well as to a wide class of learning tasks without a teacher. Cluster analysis is a multidimensional statistical procedure that collects data containing information about the selection of objects, and then organizes objects into relatively homogeneous groups (clusters) (Q-clustering, or Q-technique, actually cluster analysis). A cluster is a group of elements characterized by a common property; the main goal of cluster analysis is to find groups of similar objects in a sample.
And why is it even necessary to live without clustering? Also, no one has illuminated, I will try to remove the veil from the purpose of this concept.
- Understanding data by identifying cluster structure. Dividing the sample into groups of similar objects allows you to simplify further data processing and decision-making, applying your analysis method to each cluster (divide and conquer strategy).
- Data compression. If the initial sample is excessively large, then you can reduce it, leaving one of the most typical representative of each cluster.
- Detection of novelty (eng. Novelty detection). There are atypical objects that cannot be attached to any of the clusters.
In the first case, the number of clusters trying to do smaller. In the second case, it is more important to ensure a high degree of similarity of objects within each cluster, and clusters can be as many as you like. In the third case, the most interesting are the individual objects that do not fit into any of the clusters. In all these cases, hierarchical clustering can be used, when large clusters are broken up into smaller ones, which in turn are split up even smaller, and so on. Such problems are called taxonomy tasks. The taxonomy results in a tree-like hierarchical structure. In addition, each object is characterized by listing all the clusters to which it belongs, usually from large to small. A classic example of the similarity-based taxonomy is the binomial nomenclature of living beings, proposed by Carl Linnaeus in the middle of the 18th century. Similar systematization is built in many areas of knowledge in order to streamline information about a large number of objects.
The theory is enough for now, let's return to the problem, now that someone has met the term, someone has refreshed in his head, and who has completely missed, we will solve the problem. The k-means clustering method is used for the solution, because this method does not require preliminary assumptions regarding the number of clusters; in order to be able to use this method, it is necessary to have a hypothesis about the most probable number of clusters. The general idea of the algorithm: a given fixed number of k clusters of observations are compared to clusters so that the averages in the cluster (for all variables) differ as much as possible from each other. For fans of pictures and an attempt to "explain on the fingers" (when the number of clusters is equal to two):
The main advantages of the k-means algorithm:
- ease of use;
- speed of use;
- clarity and transparency of the algorithm.
Disadvantages of the k-means algorithm:
- The algorithm is too sensitive to outliers that can distort the mean. A possible solution to this problem is to use a modification of the algorithm — the k-median algorithm;
- the algorithm may run slowly on large databases. A possible solution to this problem is to use data sampling.
Practical difficulties and their solution
I want to say at once that everything was done in Mathworks’s Matlab math package (the description of the implementation is a separate extensive article). Applying the k-means for the original image given at the beginning, we get the following segmented image:
It is seen that most clusters do not have clear boundaries, overlap each other. Comparing the two figures, it is not difficult to notice that atypical objects have appeared (“divorces” on the wall and the floor), which are desirable (rather necessary for a real task) to be assembled into a common cluster. This is due to the fact that the algorithm is too sensitive to outliers, which can distort the average and it is necessary to perform preliminary image processing .
The first thing that came to mind after much deliberation was the median image filtering, which is the solution for effectively removing noise while preserving the details of the image that are important for subsequent recognition. The complexity of solving this problem essentially depends on the nature of the noise. Unlike deterministic distortions, which are described by functional transformations of the original image, models of additive, pulsed and multiplicative noise are used to describe random effects. And now we will smoothly plunge into the theory.
The most common type of interference is random additive noise, which is statistically independent of the signal. The additive noise model is used when the signal at the output of the system or at any stage of the conversion can be considered as the sum of the useful signal and some random signal. The additive noise model describes well the action of film grain, fluctuation noise in radio systems, quantization noise in analog-to-digital converters, etc. Additive Gaussian noise is characterized by adding values to each pixel of the image with a normal distribution and with a zero average value. Such noise usually appears at the stage of digital imaging. The basic information in the images is carried by the contours of the objects. Classic linear filters can effectively remove statistical noise, but the degree of blurring of small details in an image may exceed acceptable values. To solve this problem, nonlinear methods are used, for example, Perron and Malik anisotropic diffusion algorithms, bilateral and trilateral filters. The essence of such methods is to use local estimates that are adequate to the definition of the contour in the image, and to smooth out such areas to the least extent. Impulse noise is characterized by replacing part of the pixels in the image with fixed or random values. In the image, such interference appears as isolated contrast points. Impulse noise is typical for devices for inputting images from a television camera, image transmission systems over radio channels, as well as for digital image transmission and storage systems. To remove impulse noise, a special class of nonlinear filters based on rank statistics is used. The general idea of such filters is to detect the position of a pulse and replace it with an estimated value, while keeping the other pixels of the image unchanged.
Median image filtering is most effective if the noise in the image is pulsed and represents a limited set of peak values against the background of zeros. As a result of the application of the median filter, the slopes and sharp differences in brightness values on the images do not change. This is a very useful property for images in which the contours carry the basic information. When median filtering noisy images, the degree of smoothing of the contours of objects directly depends on the size of the filter aperture and the shape of the mask. With small aperture sizes, contrasting details of the image are better preserved, but pulsed noise is less suppressed. For large sizes of the aperture, the opposite is true. The optimal choice of the shape of the smoothing aperture depends on the specifics of the problem being solved and the shape of the objects. This is of particular importance for the task of preserving differences (sharp brightness limits) in images.
All right, now you can show results
Everything seemed to be fine, but it was decided not to stop at what had been achieved and then almost accidentally stumbled upon a technological method of processing a photographic image, which makes it possible to achieve the effect of feeling more sharp by increasing the contrast of tonal transitions (Unsharp masking). It is important to note that unsharp masking does not really sharpen the image. It cannot restore the image of a part that was lost at different stages of production (during shooting, scanning, resizing, and printing reproduction). Unsharp masking enhances the local image contrast in those areas where abrupt changes in color gradation were originally present. Due to this, the image is visually perceived as sharper.
If it is clear, then after the median filtering and unsharp masking there will be such a picture:
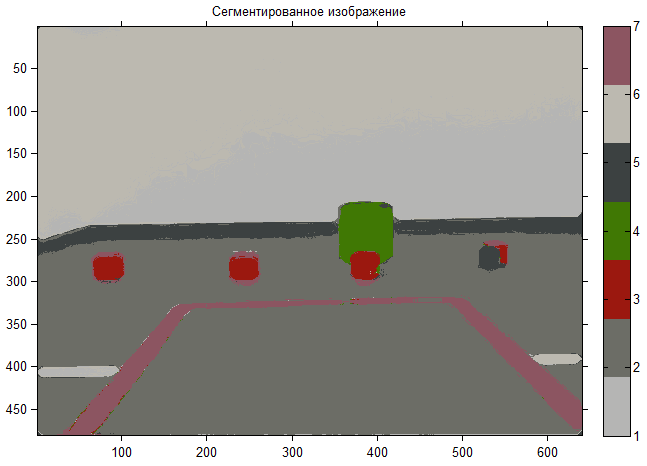
Well, now let's perform clustering and compare what was and what has become:
As you can see, the number of clusters immediately decreased and now they have clearer boundaries, we can assume that the problem has been solved, it only remains to offer a tool for selecting an object into an image.
Select objects. The final stage
When cluster analysis is performed, you can determine the coordinates of the target object in the image. For this cluster, they are represented by binary images (masks), on which the values of each pixel are conditionally coded (0 - background or background, 1 - foreground), that is, segmentation with the selection of boundaries. For example, the mask of a green object will be
Thank you for your attention, I hope you have been and will be helpful.
Source: https://habr.com/ru/post/108212/
All Articles