Intel Core 2 Processor Cycle Analysis
When analyzing the performance of applications to improve it, the most powerful method available is the detailed analysis of CPU cycles. The traditional analysis of the completion of instructions is unlikely to help when we talk about the architecture that applies reordering of instructions (Out of Order, OOO), whose main task is to continue to execute instructions until their completion is possible.
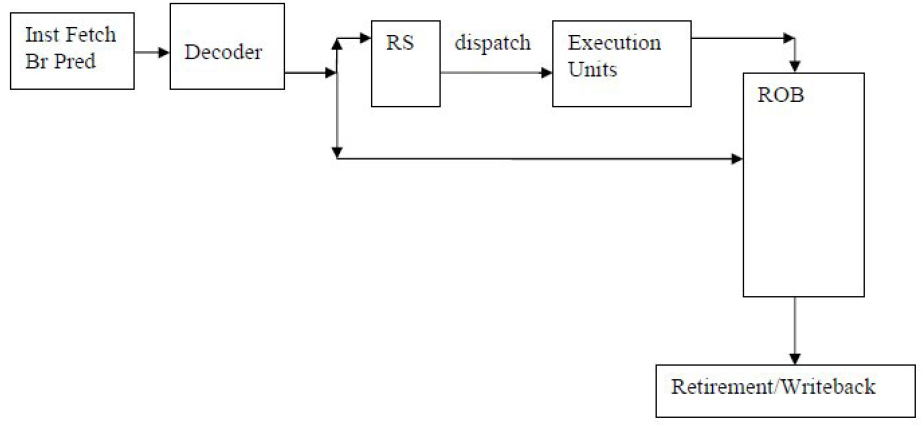
To develop a methodology based on counting the use of cycles, it is necessary to become familiar with the basics of the OOO implementation mechanism. An extremely simplified block diagram is presented in Figure 1.
')
After the instructions are decoded in a micro-operation (uops), they are passed on if the necessary resources are available.
This is (among others):
The completion and deferred recording of state in visible registers is performed only for instructions and micro-operations that are in the correct execution branch. Instructions and microoperations of incorrectly predicted branches are reset as soon as a transition prediction error is detected, then the correct branch is loaded. Completion of the correct instructions of the branch of execution can occur under the observance of 2 conditions:
Such mechanics ensures that the visible state of the program always coincides with that which would have been in the orderly execution of instructions.
The “magic” of such a design is that, if the oldest instruction is blocked, for example, waiting for the arrival of data from memory, subsequent independent instructions, whose operands are available, can be sent to operational devices and stored in ROB, pending completion. They will be ousted when all previous work is completed.
The difficulty, from the point of view of performance analysis, is that the completion of instructions in the system occurs in "batches", that is, some cycles do not generate complete instructions, and some are accompanied by large flows of them. Thus, what happens in a separate loop on the completion block is terribly non-informative, and you need to use the averaged values of time and relationships to understand what is actually happening. The problem that arises is that when relationships are used as a performance metric, the process of optimizing the application will inevitably change both the numerator and the denominator, casting doubt on the progress made. Consider the standard instruction execution rate, “The number of cycles per completed instruction” (Cycles per Instruction, CPI), in the case of cycle optimization.
A high CPI value is considered a sign of poor performance, while a low value is considered a sign of good performance. If during the optimization process the cycle is vectorized, that is, when compiling it generates instructions from the Streaming SIMD Extension (SSE) set, then the number of completed instructions will drop significantly (by a factor of 2 or more). However, the number of cycles spent on the account is unlikely to decrease to the same extent, since this optimization will not affect such things as unsuccessful calls to the last level of CACHES that stop execution. Ultimately, the vectorization of the cycle only guarantees an increase in the number of CPIs. In fact, in order to reduce the CPI, it is necessary to increase the number of completed instructions!
Instead of focusing on metrics based on the relationship between the number of CPU vital events, you can simply focus on reducing the number of cycles consumed in doing the desired work.
The analysis of the use of cycles simplifies the task, allowing the developer to reduce the individual contribution of the components consuming the cycles by counting them. In this case, the main indicator is only cycles, and the process of optimizing the application always lowers the main metric.
Further:
Full article in PDF format
To develop a methodology based on counting the use of cycles, it is necessary to become familiar with the basics of the OOO implementation mechanism. An extremely simplified block diagram is presented in Figure 1.
')
After the instructions are decoded in a micro-operation (uops), they are passed on if the necessary resources are available.
This is (among others):
- space in the Reservation Station (RS), where micro-operations are awaiting the appearance of their operands;
- the space in the Sequence Recovery Buffer (Re-order Buffer, ROB), where micro-operations are waiting for completion;
- A sufficient amount of loading and unloading buffers in the case of micro-operations related to working with memory (loading and unloading).
The completion and deferred recording of state in visible registers is performed only for instructions and micro-operations that are in the correct execution branch. Instructions and microoperations of incorrectly predicted branches are reset as soon as a transition prediction error is detected, then the correct branch is loaded. Completion of the correct instructions of the branch of execution can occur under the observance of 2 conditions:
- All microoperations associated with this instruction have been completed, which allows to complete the entire instruction;
- All previous instructions and their microoperations in a correctly predicted branch are completed.
Such mechanics ensures that the visible state of the program always coincides with that which would have been in the orderly execution of instructions.
The “magic” of such a design is that, if the oldest instruction is blocked, for example, waiting for the arrival of data from memory, subsequent independent instructions, whose operands are available, can be sent to operational devices and stored in ROB, pending completion. They will be ousted when all previous work is completed.
The difficulty, from the point of view of performance analysis, is that the completion of instructions in the system occurs in "batches", that is, some cycles do not generate complete instructions, and some are accompanied by large flows of them. Thus, what happens in a separate loop on the completion block is terribly non-informative, and you need to use the averaged values of time and relationships to understand what is actually happening. The problem that arises is that when relationships are used as a performance metric, the process of optimizing the application will inevitably change both the numerator and the denominator, casting doubt on the progress made. Consider the standard instruction execution rate, “The number of cycles per completed instruction” (Cycles per Instruction, CPI), in the case of cycle optimization.
A high CPI value is considered a sign of poor performance, while a low value is considered a sign of good performance. If during the optimization process the cycle is vectorized, that is, when compiling it generates instructions from the Streaming SIMD Extension (SSE) set, then the number of completed instructions will drop significantly (by a factor of 2 or more). However, the number of cycles spent on the account is unlikely to decrease to the same extent, since this optimization will not affect such things as unsuccessful calls to the last level of CACHES that stop execution. Ultimately, the vectorization of the cycle only guarantees an increase in the number of CPIs. In fact, in order to reduce the CPI, it is necessary to increase the number of completed instructions!
Instead of focusing on metrics based on the relationship between the number of CPU vital events, you can simply focus on reducing the number of cycles consumed in doing the desired work.
The analysis of the use of cycles simplifies the task, allowing the developer to reduce the individual contribution of the components consuming the cycles by counting them. In this case, the main indicator is only cycles, and the process of optimizing the application always lowers the main metric.
Further:
- Performance Based Analysis
- Downtime Decomposition
- Error Predictions Transitions and Intelligent Execution
- Evaluation of the occurrence of problematic Performance Events
- Application analysis
- Main remarks on code optimization
- Instruction level parallelism
Full article in PDF format
Source: https://habr.com/ru/post/107650/
All Articles