The mechanism of the image recognition technology TAPe
Hello, dear Habravchane.
Thanks to everyone who left comments on our past post. Today we will try to tell you more about TAPe-technology developed by our company, what is its essence and features. And also tell you a little about how to recognize images.
Anyone interested in image recognition please under the cat.
')
So, in the last article we talked about the new image recognition technology. If we describe technology in general terms, the mechanism of action is as follows: there is a certain set of frames (video sequence), and there is also a reference sequence of frames (or one image). In order to find a reference sequence among a given set, images are created for all frames of the standard and set - the “impressions” , which uniquely describe the image.
These "snapshots" are some important skeletons or integral curves - files in the TAPe format . It is these “casts” that we compare with each other. If identical "snapshots" are found, then completely identical frames are found. Otherwise, a special measure is introduced that defines the “visual similarity” of frames, which is called the distance d. The smaller the distance, the higher the “visual similarity”.
The most commonly used term for such an approach to the presentation of the standard and the original set is Digital Fingerprints. A “digital print” is a certain set of features that characterizes a given image. The decision on the compliance of the standard with the image in question in this case is made by comparing the "digital fingerprints" of the image and the standard. In this case, the most appropriate standard or set of standards satisfying a given percentage of similarity is selected.
In the case of our algorithm, for distances less than 0.175 (hereinafter, the distance scale is conditional) - frames are the same with almost 100% probability .
The logical question is where does this figure come from? We explain. We conducted a series of experiments. A lot - more than a thousand. The essence of the experiment was as follows: we took two obviously identical video clips recorded from different sources (television from analog and satellite channels), and then successively compared each pair of frames using our TAPe technology and recorded the result.
Then plotted a density distribution. So we got the first (blue) graph. After that, we changed the sequence of frames on one of the fragments (started up in the reverse order, shifted to a different number of frames, etc.) to get a sample of obviously different frames, also compared, and also recorded the result. So we got the second (pink) graph (chart 1A and 1B).
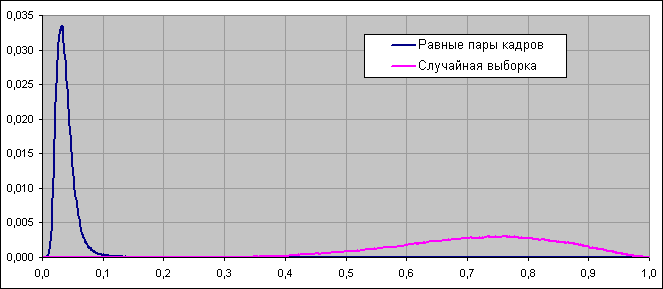
Diagram 1A. Graphs of density distribution when comparing images using TAPe-technology.
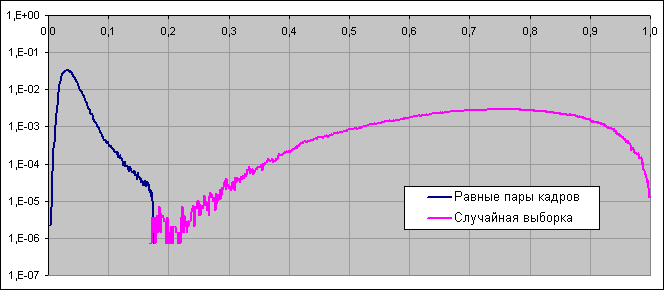
Chart 1B. Graphs of density distribution when comparing images using TAPe-technology (logarithmic scale).
The diagram shows that in the case of identical frames, all the results of the comparison lie in the interval between 0 and 0.175, and in the case of different frames, almost all the results are outside this interval. This graph shows the result of approximately 1.5 million comparisons for the same and the same for different options. Of these, only 21 values of the comparison of different frames fell into the gap to 0.175. In the language of mathematical statistics, in this case, the error of the first kind (false positive) is:
Alpha = 21/1500000 = 0.000014
In turn, the error of the second kind (signal skip):
Betta = 0/1500000 = 0.0
That is, the error is negligible.
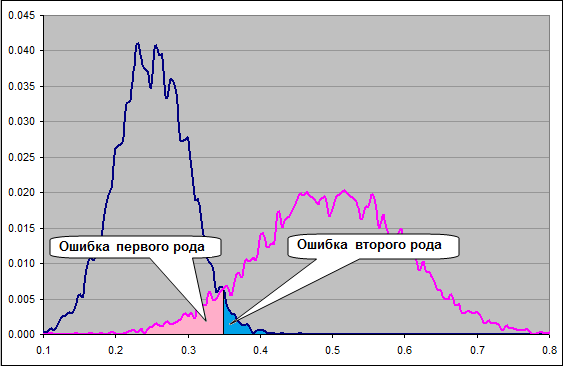
Visual view of the errors of the first and second kind.
But this is just one experiment, what does it prove? The bottom line is that the results of all our experiments almost coincide . In each case, the diagram looks the same, the error is minimal. That is why we use a threshold equal to 0.175, as the defining criterion for the identity of frames.
For comparison, consider the analysis of the same parameter (the distance between a pair of frames) using the simplest method of image comparison described in many textbooks by comparing their brightness histograms. We analyzed the same data in the same way as in the first case. Result on the chart:
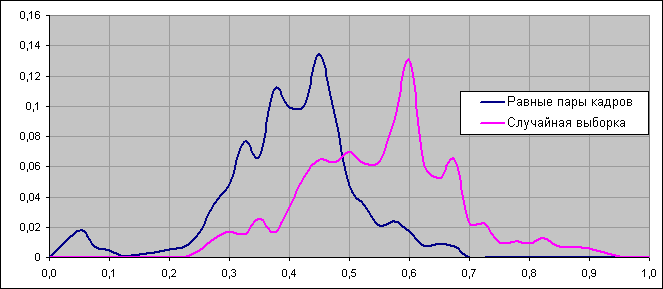
Diagram 2A. Graphs of distribution density when comparing images by comparing the brightness histograms.
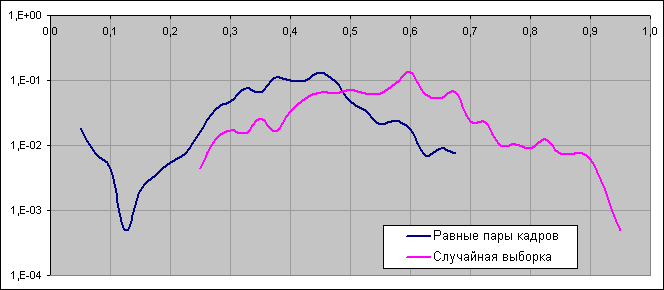
Chart 2B. Graphs of density distribution when comparing images by comparing the brightness histograms (logarithmic scale).
By the way, the graphs clearly show errors (for threshold 0.48)
Alpha = 0.3055
Betta = 0.1680
We have developed a technology that allows you to quickly search for a model video inside a huge array of video data with good completeness and reliability. That is why we initially focused our attention on the search for commercials on television, and the source of the television signal is not important - whether it is digital television, cable broadcasting or even simple analogue broadcasting.
However, we believe that monitoring television is not the only way to apply our technology. That is why we appeal to you, Habrazhiteli - perhaps you have ideas for another use. At the moment we are developing an API so that you can fully utilize the capabilities of our technology. Offer us your ideas regarding the future of the API functionality, and we will take them into account when developing. You can send suggestions in PM or leave comments. We want to make TAPe technology as useful and convenient as possible.
Thanks to everyone who left comments on our past post. Today we will try to tell you more about TAPe-technology developed by our company, what is its essence and features. And also tell you a little about how to recognize images.
Anyone interested in image recognition please under the cat.
')
The mechanism of the technology
So, in the last article we talked about the new image recognition technology. If we describe technology in general terms, the mechanism of action is as follows: there is a certain set of frames (video sequence), and there is also a reference sequence of frames (or one image). In order to find a reference sequence among a given set, images are created for all frames of the standard and set - the “impressions” , which uniquely describe the image.
These "snapshots" are some important skeletons or integral curves - files in the TAPe format . It is these “casts” that we compare with each other. If identical "snapshots" are found, then completely identical frames are found. Otherwise, a special measure is introduced that defines the “visual similarity” of frames, which is called the distance d. The smaller the distance, the higher the “visual similarity”.
Digital fingerprints
The most commonly used term for such an approach to the presentation of the standard and the original set is Digital Fingerprints. A “digital print” is a certain set of features that characterizes a given image. The decision on the compliance of the standard with the image in question in this case is made by comparing the "digital fingerprints" of the image and the standard. In this case, the most appropriate standard or set of standards satisfying a given percentage of similarity is selected.
Calculation accuracy
In the case of our algorithm, for distances less than 0.175 (hereinafter, the distance scale is conditional) - frames are the same with almost 100% probability .
The logical question is where does this figure come from? We explain. We conducted a series of experiments. A lot - more than a thousand. The essence of the experiment was as follows: we took two obviously identical video clips recorded from different sources (television from analog and satellite channels), and then successively compared each pair of frames using our TAPe technology and recorded the result.
Then plotted a density distribution. So we got the first (blue) graph. After that, we changed the sequence of frames on one of the fragments (started up in the reverse order, shifted to a different number of frames, etc.) to get a sample of obviously different frames, also compared, and also recorded the result. So we got the second (pink) graph (chart 1A and 1B).
Diagram 1A. Graphs of density distribution when comparing images using TAPe-technology.
Chart 1B. Graphs of density distribution when comparing images using TAPe-technology (logarithmic scale).
The diagram shows that in the case of identical frames, all the results of the comparison lie in the interval between 0 and 0.175, and in the case of different frames, almost all the results are outside this interval. This graph shows the result of approximately 1.5 million comparisons for the same and the same for different options. Of these, only 21 values of the comparison of different frames fell into the gap to 0.175. In the language of mathematical statistics, in this case, the error of the first kind (false positive) is:
Alpha = 21/1500000 = 0.000014
In turn, the error of the second kind (signal skip):
Betta = 0/1500000 = 0.0
That is, the error is negligible.
Visual view of the errors of the first and second kind.
But this is just one experiment, what does it prove? The bottom line is that the results of all our experiments almost coincide . In each case, the diagram looks the same, the error is minimal. That is why we use a threshold equal to 0.175, as the defining criterion for the identity of frames.
Error when using the "standard" method
For comparison, consider the analysis of the same parameter (the distance between a pair of frames) using the simplest method of image comparison described in many textbooks by comparing their brightness histograms. We analyzed the same data in the same way as in the first case. Result on the chart:
Diagram 2A. Graphs of distribution density when comparing images by comparing the brightness histograms.
Chart 2B. Graphs of density distribution when comparing images by comparing the brightness histograms (logarithmic scale).
By the way, the graphs clearly show errors (for threshold 0.48)
Alpha = 0.3055
Betta = 0.1680
Conclusion
We have developed a technology that allows you to quickly search for a model video inside a huge array of video data with good completeness and reliability. That is why we initially focused our attention on the search for commercials on television, and the source of the television signal is not important - whether it is digital television, cable broadcasting or even simple analogue broadcasting.
However, we believe that monitoring television is not the only way to apply our technology. That is why we appeal to you, Habrazhiteli - perhaps you have ideas for another use. At the moment we are developing an API so that you can fully utilize the capabilities of our technology. Offer us your ideas regarding the future of the API functionality, and we will take them into account when developing. You can send suggestions in PM or leave comments. We want to make TAPe technology as useful and convenient as possible.
Source: https://habr.com/ru/post/107418/
All Articles