The Case of the Intermittent Windows Freezes
Of course, I expected that the previous post will appeal to people, but I could not even imagine how much . This post, in my opinion, is both more and less interesting than the previous one. While last time it was a fascinating casual game - completely meaningless and time-consuming, but pleasing with its unusual gameplay and, most importantly, interactive and accessible to everyone who wants it, now it's more like a detective story - allowing you to empathize and try guess the further development of the plot, but leaving no room for interactivity. On the other hand, “detective” “is based on real events,” which adds special charm to what is happening.
It all started with a question in Q & A.
For those who are too lazy to follow the links, let me quote the question itself:
Actually, sometimes when you open "My computer" with a list of disks or when you insert a USB flash drive / DVD, the computer just stops dead (the mouse does not move, the keyboard does not respond to the NumLock), i.e. complete lack of response to external stimuli. After 10-30 seconds, the comp dies off itself, as if nothing had happened. The question itself is how to determine the cause of such a suspension of the system and how to deal with it.
Well, and additional information: hardware RAID 4x640 (envy), updating firewood does not help, SMART is silent, tests also.
')
As one very good person wrote : “The locals avoid going to the desert in the summer for three reasons. Rattlesnakes, ticks and scorpions. Idea! - I thought. I just have a tent. ”
First idea: someone takes an interrupt and decides to “take a break” in the ISR. It is also possible that this someone simply raises the IRQL to an indecent level and still decides to “take a break”. We will catch with the help of the same xperf.
xperf -on latency -stackwalk profile -maxfile 128 -filemode circular
Explanations:
We include latency - what else do we need to include for catching delays? As xerf -providers K tells us:
Latency: PROC_THREAD + LOADER + DISK_IO + HARD_FAULTS + DPC + INTERRUPT + CSWITCH + PROFILE
In other words, DISK_IO + HARD_FAULTS are added to the required PROC_THREAD + LOADER, which is necessary for linking what is happening to the actual binaries, which in my personal top take the first place in killing the performance of any system (it seems that Microsoft agrees with me), problems are rare, but if they deliver, then with heart, CSWITCH - context switch - to track deadlocks and wrong priorities, and PROFILE - profile interrupt events (by default, every millisecond)
There is every reason to believe that the interruption profile will still be delivered even if everything else in the system does not show signs of life. Here is a list of predefined IRQL in Windows:
#define PASSIVE_LEVEL 0 #define LOW_LEVEL 0 #define APC_LEVEL 1 #define DISPATCH_LEVEL 2 #define PROFILE_LEVEL 27 #define CLOCK1_LEVEL 28 #define CLOCK2_LEVEL 28 #define IPI_LEVEL 29 #define POWER_LEVEL 30 #define HIGH_LEVEL 31 Above the profile only clock, interprocessor interrupts and power interruptions. None of these interrupts is given to third-party drivers, respectively, if profile interrupt is disguised - this will also greatly narrow the search space.
"-stackwalk profile" means that for each PROFILE event, the full spectrum will also be shot. Anyone who has ever used the sampled profiler will immediately appreciate this opportunity: so what, that we spent 90% of the time in some kind of spinlock - it's important for us to know who pulled this spinlock.
"-maxfile 128 -filemode circular" is the idea of circular buffers familiar to any programmer. Since hangs occur once a day or two, and information is generated about a megabyte every second, it may be enough space to collect a full log during this time (4x640, cho), but it will be harder to open (or even send) for analysis.
Silks arranged - waiting. The first victim came across in 4 days:

And it looked like this:
Moreover, by a strange coincidence


I reached it, I thought, and climbed into the search.

Imagination vividly painted a picture in which the interruption for some purposes is serialized and delivered to the processing in the user process (in principle, this can be implemented on multiprocessor systems, and such idiocy as such a decision — well, they like people — they like to write indecent acts). To the credit of user Mear , he did not immediately demolish NIS and then I noticed one detail from the very first screenshot: 1.2 million lost events. A gap in the graphs is not a lack of activity, but an overflow of buffers and overwriting them with new data if it is not possible to flush buffers to disk (someone may have been stuck in the disk interrupt or somehow blocked the I / O manager).
Well, since the system eventually "dies off" - our task is to add everything into memory until it becomes possible to reset everything to disk:
xperf -on latency -stackwalk profile -maxfile 256 -filemode circular -buffersize 1024 -minbuffers 256
Add buffer size and minimum number of buffers. We wait. A day later we get a beautiful lossless log:
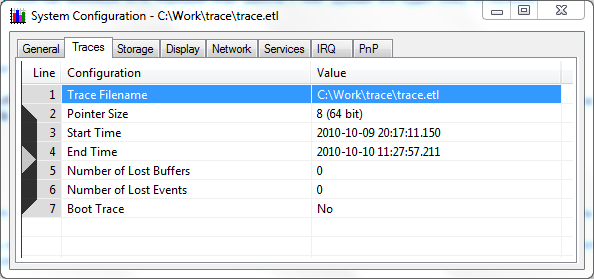
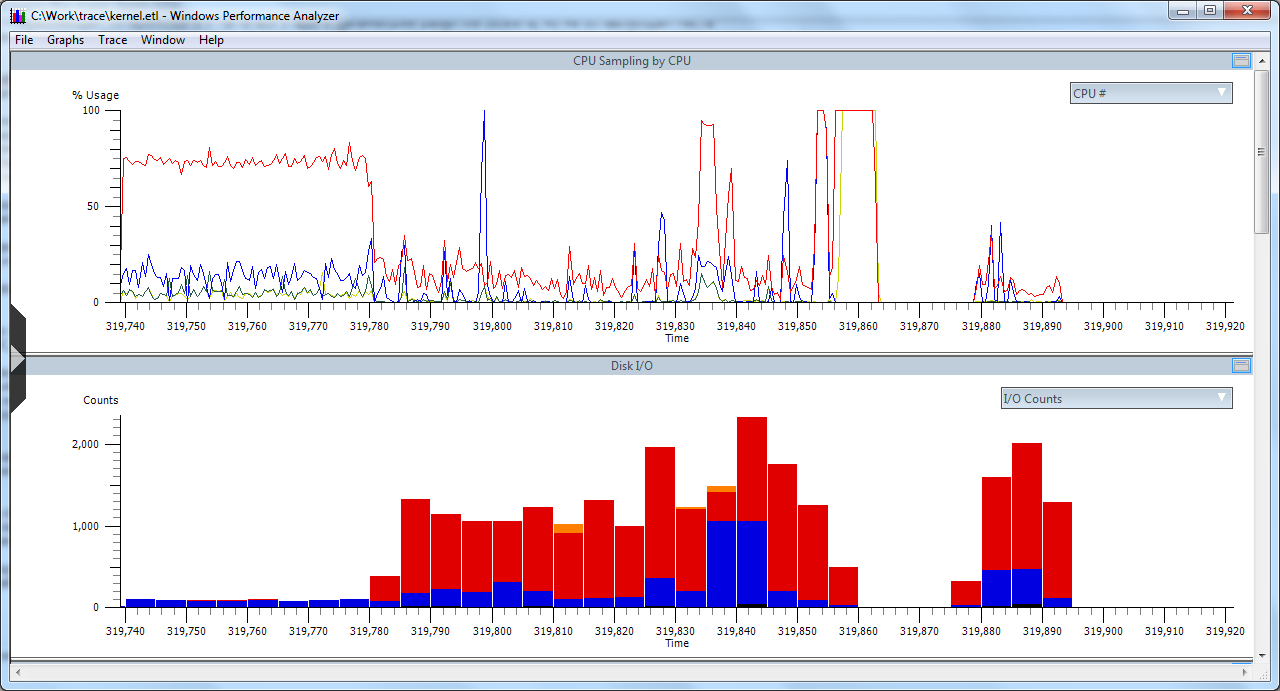
Unfortunately, “my eyes and hands” on that side lingered with the stop of the trace and began to browse without stopping and almost lost the actual problem point itself. But fortunately, there was enough information (the graph shows a burst of DPC handlers gradually going beyond the cyclic buffer)
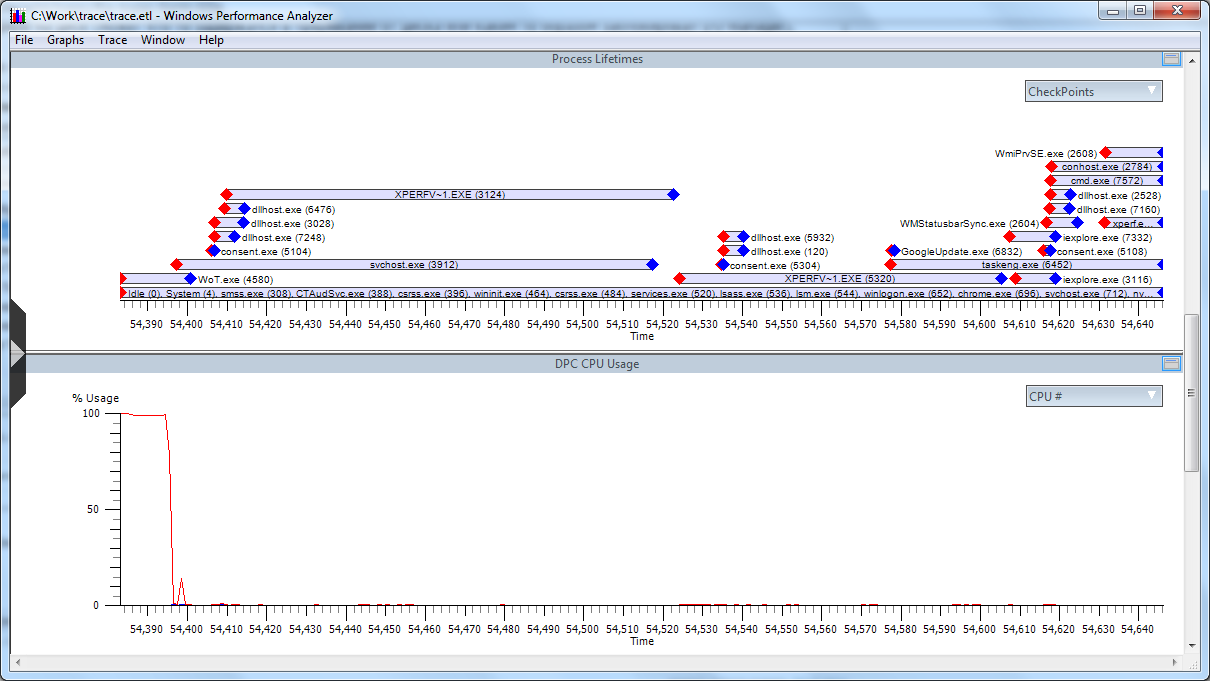
Well, we make a zoom on the problem area and begin the study.
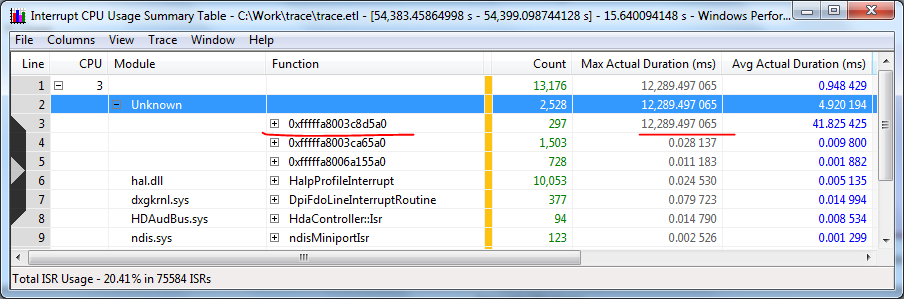
First of all, we see an ISR that takes 12 seconds.
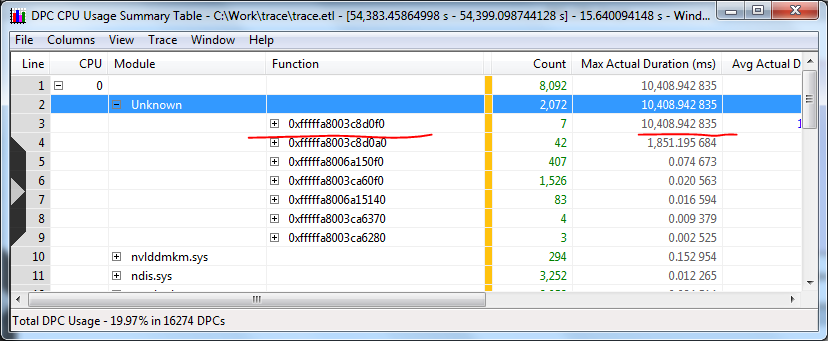
And the DPC is ranked 10
Unfortunately, it’s impossible to find a module at the problem address, but it’s not for nothing that I wrote down the charms of stackwalk right at the beginning:

Here, at the very bottom of the stack, we see the “unknown” stub address, which calls spcl.sys, which in turn calls directly scsiport. Expand the stack further:
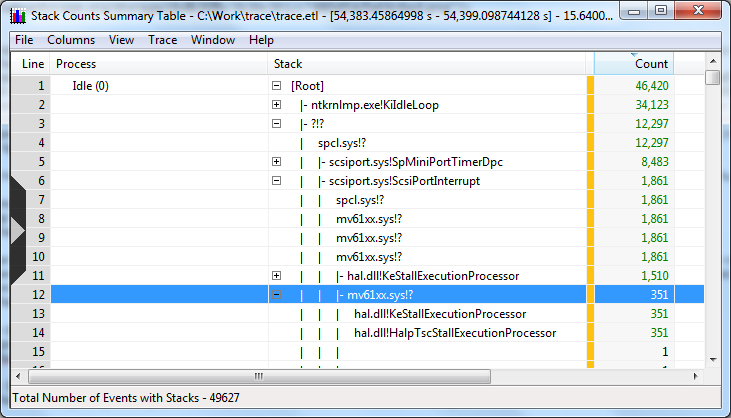
Once again we go to spcl.sys, from there we get to mv61xx.sys, which is calling KeStallExecutionProcessor (SRSLY? In the interrupt handler?). In another way, we spend on one more call in mv61xx and still begin to rest.
A similar picture emerges when processing DPC (although this is no longer so critical for a multiprocessor system):

A couple of minutes of search leads us to the authors spcl and mv61xx - this is SPTD (used in Daemon Tools and Alcohol xxx%) and the Marvell driver. These ones:

To begin, update the hardware driver and shutdown sptd - the problems have stopped. Carefully turn on sptd back: two weeks - normal flight.
PS: This post would be impossible without Mear . He provided a problem system for inhuman experiments and helped me find this problem in every possible way.
Source: https://habr.com/ru/post/107161/
All Articles