Cacti and Network UPS Tools
It is time for cold weather, and with the first snow, problems with electricity also fall on our heads. The owners of the UPSs connected to the NUTs on their servers face the problem of monitoring the status of the UPSs (of course, you can remove the statistics manually or via the cgi script in the browser, but sitting with a leaf and recording the changes is clearly not our method). A long googling on this topic did not give a clear and elegant answer. Many instructions have become outdated long ago, and software developers have already made many changes, without the knowledge of which success cannot be achieved quickly.
To configure UPS monitoring in Cacti:
1) Cacti> = 0.8.7g
2) Network UPS Tools> = 2.4.1_6 (I think it will work with others)
3) Archive: cacti-nut.zip ( mirror ) (I used the scripts downloaded here and slightly corrected by the user Wilmer from the Cacti forum and me)
')
Cacti
Extract the files from the archive into the following folders:
ss_nut_ups_status.php <path_cacti>/scripts/
nut_ups_status.xml <path_cacti>/resource/script_server/
Import the template from the archive
Console > Import Templates > - cacti_data_query_nut_ups_statistics.xmlCacti will report a successful import of the template, indicating which data was received. (!) We check the rights to the copied files.
NUT
In the upsd.conf configuration file, we check the LISTEN directive and it should contain the interface address that will accept Cacti requests. I have it as follows:
LISTEN 127.0.0.1
LISTEN 10.10.11.100
Also, if my memory serves me, you can use an ACL.
Restart the NUT and return to Cacti. Go to the Cacti web interface in the Console> Devices> [our server with NUT] section and add the Data Query on the Associated Data Queries panel: NUT - UPS Statistics> Add. After that, in the added line in the status column you should see something like the following
Success [2 Items, 1 Row]If the line contains zeros instead of the number of values and lines, you can try to reload the values by clicking on the green circle on the right. If this did not help, you should check the firewall settings (both on the server and on the computer with Cacti), as well as look in the Cacti logs before turning on the maximum level of displayed events.
The next step is to create a schedule for the host. At the top of the device settings page, click Create Graphs for this Host. There we see the Data Query [NUT - UPS Statistics] panel in the row of which our UPSs are located. Check the necessary (s) and in the drop-down menu under the panel select the graph type:
UPS Load Capacity - displays the UPS battery charge level and output load as a percentage.
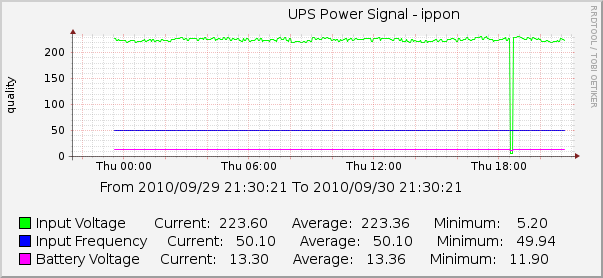
UPS Power Signal - displays the incoming voltage, frequency and voltage on the battery.
UPS Temperature - the temperature of the UPS.
click Create. After that, a message about the created charts will be displayed at the top of the page. Go to the Graphs tab and wait for the information of interest to us soon. And remember that for drawing RRD graphics, 2 points are required, i.e. There should be 2 polls before we see the data.
Have nice charts!
Source: https://habr.com/ru/post/105308/
All Articles