Intel VTune Amplifier XE 2011 beta under the strict eye of the programmer

I decided to look at the new Intel VTune Amplifier XE 2011 beta and write an article about an example of use. However, in the process of writing, the emphasis was partially shifted from using Amplifier to testing it. But this is also good, I hope the developers at Intel will take into account the wishes and make changes to the next version of the tool. In general, I will criticize myself and everyone. :)
I will start a little from afar, otherwise there will be questions why I needed the code that I had to optimize. During the development of a static code analyzer for C ++, I have to deal with very exotic program fragments. What only programmers do not invent. And even compilers such as Visual C ++ or Intel C ++ no, no, yes, and they will fall on the next “zagullin”.
')
In our PVS-Studio static analyzer, there is one not very good place associated with determining the type of objects. There is, for example, a design:
  typedef int A;
 typedef AB;
 B myValue;
and you need to “calculate” type B to find out that it is nothing but an int. With similar examples, of course, there are no difficulties and everything works. However, there are very confusing situations. I will give an example of code that demonstrates where different difficulties start to appear:
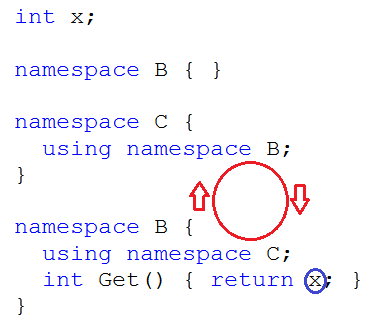
When trying to find out the type of a variable X, we look at its type in namespace B and don’t find it there. Then we will see what we need to look in the namespace C. And we will not find it there either. Now you need to look at the namespace B ... Eternal loop. Of course, this is a simple case and there are no problems with it either. But add here typedef, templates, inherited classes. Sometimes surprisingly complex things are obtained, and not on purpose. This is especially evident in the code with templates.
Unfortunately, the PVS-Studio tool sometimes entered the perpetual cycle on particularly “successful constructions” and made suicide after 5 minutes so that it was possible to continue processing other files. Very rare situation, but unpleasant. Errors, of course, are ruled and are ruled, but all new situations are found. And it is not always possible to find out what kind of code this user has. It was decided not to completely terminate the analyzer's work by timer, but to refuse to receive the type of some object if a loop occurs. It is better to skip one variable than the entire file.
It shows a very interesting moment of incompatibility between theory and practice. Theoretically, it is necessary to write so that there are no errors. You can even chide us. The developers of the static analyzer, the writers of articles how to write without errors, but they themselves can not make the correct analysis of the type of variables. But it turns out that we can not. And not only us. The tasks associated with compiling C ++ code are extremely complex. And we have to move from arguments about the high and beautiful to creating patches just in case.
A simple but effective stopping mechanism was created. If upon receipt of the object type, we get a pointer to the coded type, with which we have already worked before, then stop. To begin with, we simply created a class containing a set of pointers in std :: set <const void *> * m_pGuardPointers. If the set already has a pointer, then it's time to stop.
I was not surprised when the program's performance after such a change dropped many times. I expected a similar effect. He didn’t even measure the speed, and it’s clear that it’s very slow and the reason is clear. Typically, the depth of the "output" type is not great, and using heavy artillery for such cases is just silly:
typedef long LONG; LONG x;
A class of the following form was immediately written (given in abbreviated form):
  class CPointerDuplacateGuard
 {
   static const size_t QuickMaxSize = 10;
   const void * m_ptrs [QuickMaxSize];
   size_t m_index;
   std :: set <const void *> * m_pGuardPointers;
 public:
   CPointerDuplacateGuard ();
   CPointerDuplacateGuard (const CPointerDuplacateGuard * parent);
   ...
 };
At the beginning, we save and look for pointers in an ordinary array of 10 elements, and then we create and begin to use the set. It has become much better, but everything is several times slower than without this mechanism.
And here I decided that it was time to look at the Intel VTune Amplifier XE 2011 beta. Very good reason. Here the profiler is most welcome. It will help answer the question of whether performance is associated only with the use of std :: set, or the slowdown itself makes use of constant pointer checks. If the main performance drop is associated with std :: set, then you need to increase the value of QuickMaxSize. This will postpone the use of std :: set as a last resort. If the algorithm itself slows down, then think further.
I’ll say right away that I didn’t have the patience to work with the Intel VTune Amplifier XE 2011 beta. He introduces unimaginable inhibition in the work. Although I have a fairly powerful system (4 cores, 8 GB of memory), if the Intel VTune Amplifier XE 2011 beta window is open, even simple movement through the code is done with an effort and jerks. And the Intel VTune Amplifier XE 2011 does nothing. Rather, it loads the processor, but does not write what it does. In order not to be unsubstantiated, I will bring demo screenshots.
For greater clarity, I attached devenv.exe to the 4th kernel.

So, now I have a project, nothing happens. The figure shows that the loading of the fourth core is close to zero:
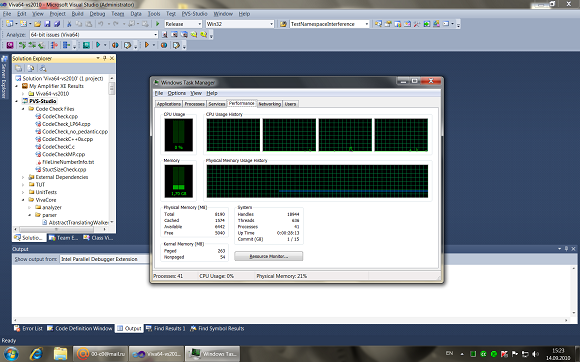
Now I just run the Intel VTune Amplifier XE 2011. Podcherku, that just run! I do not do project analysis and do nothing at all. But the fourth core is already fully occupied:
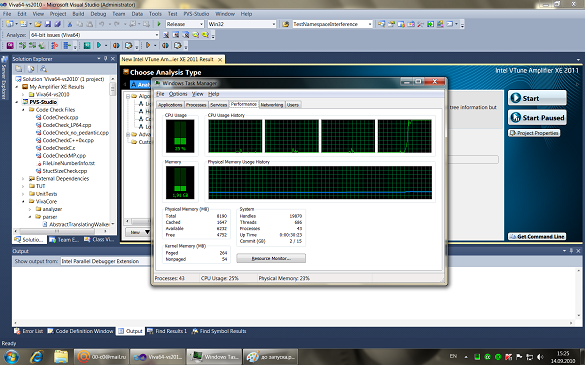
Work becomes immediately uncomfortable. Wednesday begins to slow down wherever possible. If you close the Intel VTune Amplifier XE 2011 window, the braking immediately disappears and the kernel load again becomes close to zero. Perhaps running the Intel VTune Amplifier XE 2011 does some useful work. But what is not clear. If you do, then you should at least show it. I got the feeling of some kind of mistake.
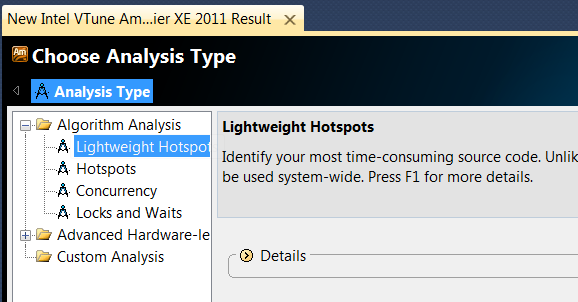
Braking did not stop me, and I began to study our program. First, I chose the analysis mode, which does not collect information about the call stack, but allows me to understand which functions are spending the most time:
The analysis was performed without surprises:

And I got a useful result:
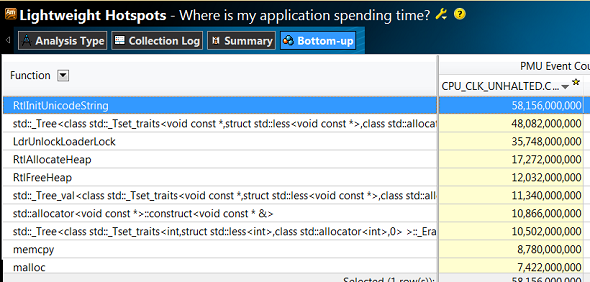
Most of the time is spent in std :: _ Tree, in functions for allocating and freeing memory. The programmer will immediately realize that the main slowdown is connected with the use of std :: set.
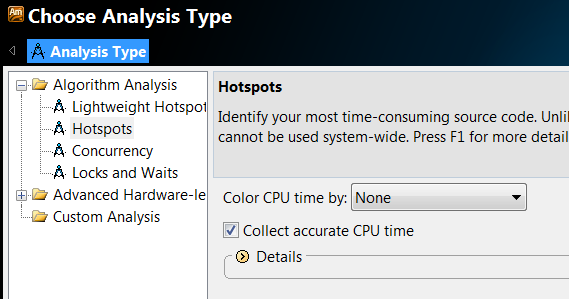
If you run Amplifier in Hotspot mode, the problem location will become much more obvious:
After this launch, it became possible to view the call stack. True, my first launch in this mode ended in failure. I was warned that with the "Collect accurate CPU time" checkbox turned on, everything will be slower. But it turned out somehow too slowly. When I pressed the stack expansion button for the first function, I didn’t wait for the result (I waited 15 minutes).
Running without a tick showed me the necessary information. But here I can not add a fly in the ointment. Functionally, the tool is great, but the interface is ugly. All the time something goes around, not redrawn, something is smeared. Use uncomfortable and unpleasant:
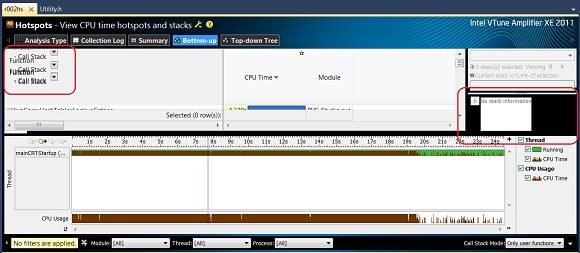
However, let not only appearance. Sometimes for some reason throws on the wrong part of the code that is needed.
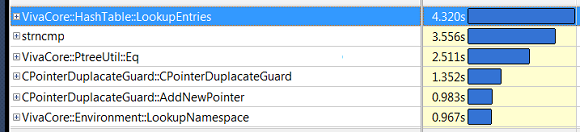
However, I still achieved the desired result. It turned out that if you set the value of the array to 64, then the performance returns to approximately the same level. The new subsystem practically does not slow down the work. Correction:
static const size_t QuickMaxSize = 64;
This is confirmed by the Amplifier. Now completely different functions, such as strncmp, have come to the fore:
findings
There is no happiness in the world of programs. Around errors and omissions. At us and in PVS-Studio, and everywhere. This does not mean that they should not be fought with, but at least a big step is to recognize the greater complexity of the programs and that there are mistakes.
The post turned out to be somewhat critical with respect to the Intel VTune Amplifier tool. Apparently this, as a developer, became sore. They propose to try another program that will improve the world, and how you start working with it, you understand that you spent more on marketing or beautiful pictures than on quality control. Well, what kind of profiler that slows down? Shoemaker without shoes. :)
Hopefully in Release this, or at least a lot, will be fixed. The tool itself is very powerful. But, unfortunately, I cannot recommend it yet. Of course, like writing in an Intel blog is somehow not good, but honest. I hope the developers will appreciate it.
Source: https://habr.com/ru/post/104275/
All Articles