Debugging Tips in Visual Studio 2010
This is the twenty-sixth publication in the VS 2010 and .NET 4 series of publications .
Today's publication discusses some useful debugging tips that you can use in Visual Studio. My friend Scott Cate (who blogged a dozen great tips and tricks on VS) recently drew my attention to some good tips that many developers using Visual Studio don't know (even though many of them work with it). long ago from earlier versions).
Hopefully this post will help you learn about them, if you do not already know about them. All of them are easy to learn, and can save you a lot of time.
Run to Cursor (Ctrl + F10) (Run to cursor)
')
Often, I see people debugging applications as follows: they set a breakpoint a lot earlier than the place they are interested in, and then they constantly use F10 / F11 to go through the code until the place they actually want to explore is reached. In some cases, they carefully inspect every expression they pass through (in such cases, using F10 / F11 makes sense). However, more often, people just try to quickly go to the line of code that actually interests them - in such cases, using F10 / F11 is not the best way to achieve such a goal.
Instead, you can use the “run to cursor” function which is supported by the debugger. Just place the cursor on the line of code to which you want to run the application, and then press Ctrl + F10 together. This will lead to the execution of the application up to this line and switch to debug mode, saving the time that could be spent on multiple presses of F10 / F11 in order to get here. This works even in cases where the code you want to get into is in a separate method or class in relation to the place you are currently debugging.
Conditional Breakpoints
Another common situation that we often see is when developers set breakpoints, execute an application, check a specific input, hit a breakpoint, and then manually check if the condition is true before deciding whether to proceed to further debugging. If the script does not match what they are doing next, they will press F5 to continue execution of the application, check some other input and repeat the process manually.
Visual Studio's ability to set conditional breakpoints provides a much, much easier way to achieve this. Conditional breakpoints allow you to switch to debug mode only if any particular condition that was set has been reached. Conditional breakpoints help you avoid manual study of the code with its further execution, and can also make the whole debugging process not requiring your manual intervention and relieve you from boring work.
How to enable Conditional Breakpoint (conditional breakpoint)
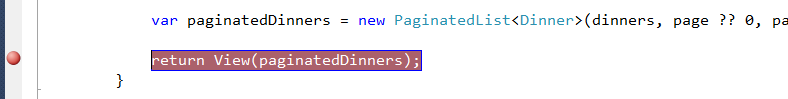
Setting conditional breakpoints in reality is simple. Press F9 in the code to set a point on a certain line ( note, you can also set a breakpoint by clicking the mouse on the left edge of the editor window exactly at the line level where you need to set a breakpoint ):
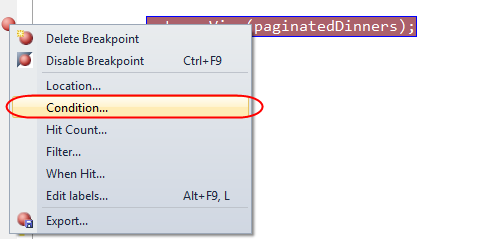
Then right-click on the red circle of the breakpoint to the left of the editor window and select the context menu “Condition ...”:
This will bring up a dialog box that allows you to specify that the breakpoint should only work if a certain condition is true. For example, we can specify that we do not need to go to debugging if the size of the local paginatedDinners list is less than 10, by typing the following expression below:
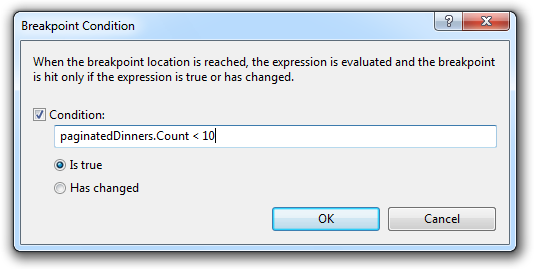
Now, when I restart the application and perform a search, the debugger will be enabled only if I perform a search that returns less than 10 dinners. If there are more than 10 dinners, then the breakpoint will not be reached.
Hit Count function
Sometimes you need to stop the debugger only if the condition is true N-times.
For example, to stop only if the search has already returned less than 10 dinners 5 times.
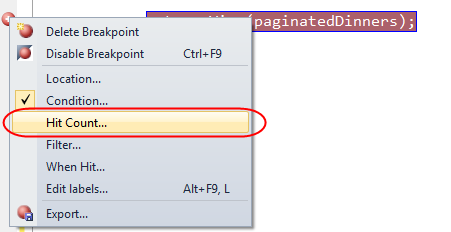
You can enable this behavior by right-clicking on the breakpoint and selecting the menu item “Hit count ...” (“Number of hits ...”).
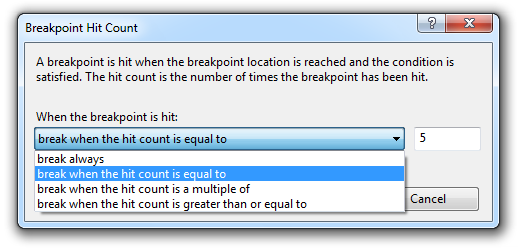
This will bring up a dialog box that allows you to specify that the breakpoint should be reached only N-times when the condition is reached either every N-times when it is reached, or every time after N occurrences:
Filtering by Machine / Thread / Process (Machine Name / Thread / Process)
You can also right-click on a breakpoint and select the “Filter ...” item from the context menu to indicate that the breakpoint should be reached if the debugging process occurs on a specific machine or in a specific process or in a specific thread.
Tracepoints - custom events when they hit a breakpoint
The debugger feature many people don’t know is the ability to use TracePoints . A trace point is a breakpoint at which a user event is triggered. This functionality is especially useful when you need to track the behavior in your application without stopping in debugging.
I use a simple console application to demonstrate how we could use Trace Points. The following is a recursive implementation of the Fibonacci series :
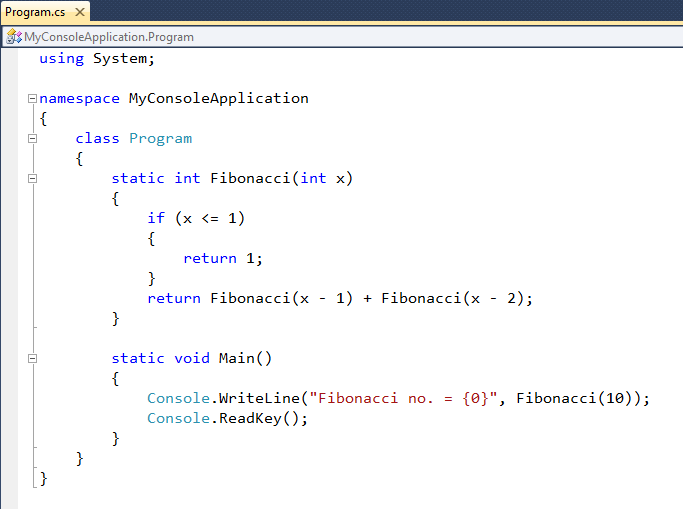
In the application above, we use Console.WriteLine () to output the final value of a series for a specific range value. What if we wanted to track the recursive sequence of the Fibonacci series in action while debugging — without actually stopping or suspending it? Trace points can help us do this easily.
Set Trace Point (TracePoint)
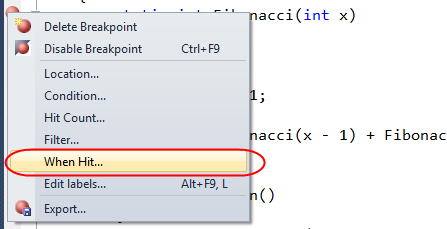
You can turn on trace points by using the F9 key to set a breakpoint in the code line and then right-click on the breakpoint and select the "When Hit ..." option from the context menu:
This will bring up a dialog box that allows you to specify what should happen when a breakpoint is reached:
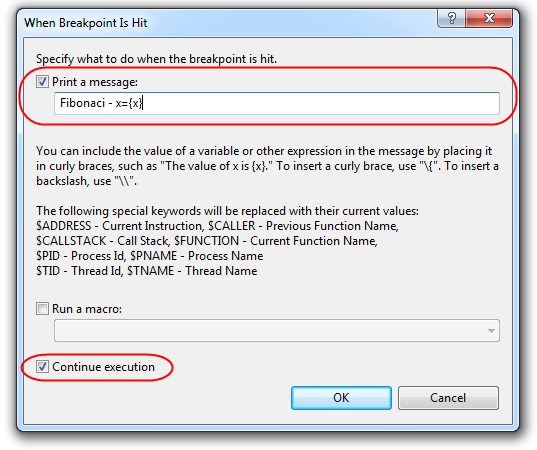
Above, we indicated that we want to output a trace message every time a breakpoint condition is reached. Notice that we have indicated that we want to output the value of the local variable “x” as part of the message. Local variables can be referenced using the {variableName} syntax. There are also built-in commands (such as $ CALLER, $ CALLSTACK, $ FUNCTION, etc.) that can be used to display common values in your trace messages.
Above, we also checked the “continue execution” checkbox below, which indicates that we do not need the application to stop in the debugger. On the contrary, it will continue to be executed only with the difference that our custom trace message will be displayed every time the breakpoint conditions are reached.
And now, when we run the application, we will see that our custom trace message is automatically displayed in the Visual Studio “output” window, allowing us to monitor the recursive behavior of the application:

As an alternative to the method described above, you can create a custom trace listener for your application; in this case, the messages generated at the trace points will be redirected to it instead of the VS. output window.
Trace Points (TracePoints) - Custom Macro Execution
In the conversation that I had last week in London, someone in the audience asked if it was possible to automatically output local variables when the Breakpoint was reached (TracePoint).
This feature is not built into Visual Studio, but can be enabled using a custom macro and then setting up a trace point to invoke the macro when that point is reached. To do this, open the integrated environment for macros inside Visual Studio (Tools-> Macros-> Macros IDE menu command). Next, under the MyMacros node in the project browser, select a module or create a new one (for example: with the name “UsefulThings”). After that, paste the following macro code on VB into the module and save it:
Vb:
C #
The macro code given above cycles through the current stack and outputs all variables to the output window.
Using our custom DumpLocals macro
Then we can use our custom macro “DumpLocals” a simple additional application, which is shown below:
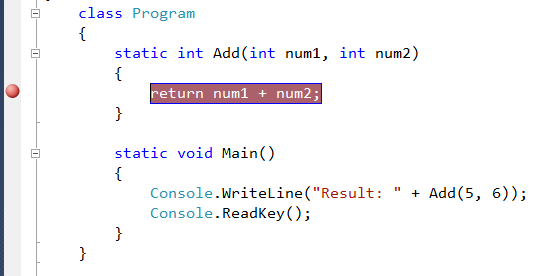
We will use the F9 key to set a breakpoint on the return expression in our method.
“Add” above. Then right-click on the breakpoint and select the “When hit” command from the context menu:

This will bring up the following dialog box. Unlike the previous code, where we used the “Print a message” checkbox and manually defined the variables we want to output, this time we will select the Run a macro checkbox instead. and specify the macro UsefulThings.DumpLocals which we created above:
We will leave the “continue execution” flag so that the program continues to run even after reaching the Trace Point.
Application launch
And now, when we press the F5 key and run the application, we will see the following output in the “output” window of Visual Studio when our Add method is launched. Notice how the macro automatically lists in the list the name and value of each variable when the Trace Point is reached:

Total
The Visual Studio debugger is incredibly rich in functions. I strongly recommend taking some time to really explore all its possibilities. The tips and tricks described above represent only a small fraction of its capabilities that people are not really aware of.
Last time I wrote a blog about other improvements in the VS 2010 debugger (including displaying a data type prompt (DataTip), Import / Export breakpoints, Saving the latest values of variables, and much more). I will continue to write in the blog about the new features of VS 2010: Intellitrace, as well as support for debugging the dump file. Publications will describe a bunch of additional cool new features that can make debugging applications even easier.
Also, do not forget to watch the excellent series of Scott Kate Visual Studio 2010 Tips and Tricks to learn how best to use Visual Studio. He has an unparalleled set of free videos and blog posts.
Hope this helps,
Scott
PS In addition to blog posts, I also now use twitter for quick updates and link exchange. Follow me: twitter.com/scottgu
Today's publication discusses some useful debugging tips that you can use in Visual Studio. My friend Scott Cate (who blogged a dozen great tips and tricks on VS) recently drew my attention to some good tips that many developers using Visual Studio don't know (even though many of them work with it). long ago from earlier versions).
Hopefully this post will help you learn about them, if you do not already know about them. All of them are easy to learn, and can save you a lot of time.
Run to Cursor (Ctrl + F10) (Run to cursor)
')
Often, I see people debugging applications as follows: they set a breakpoint a lot earlier than the place they are interested in, and then they constantly use F10 / F11 to go through the code until the place they actually want to explore is reached. In some cases, they carefully inspect every expression they pass through (in such cases, using F10 / F11 makes sense). However, more often, people just try to quickly go to the line of code that actually interests them - in such cases, using F10 / F11 is not the best way to achieve such a goal.
Instead, you can use the “run to cursor” function which is supported by the debugger. Just place the cursor on the line of code to which you want to run the application, and then press Ctrl + F10 together. This will lead to the execution of the application up to this line and switch to debug mode, saving the time that could be spent on multiple presses of F10 / F11 in order to get here. This works even in cases where the code you want to get into is in a separate method or class in relation to the place you are currently debugging.
Conditional Breakpoints
Another common situation that we often see is when developers set breakpoints, execute an application, check a specific input, hit a breakpoint, and then manually check if the condition is true before deciding whether to proceed to further debugging. If the script does not match what they are doing next, they will press F5 to continue execution of the application, check some other input and repeat the process manually.
Visual Studio's ability to set conditional breakpoints provides a much, much easier way to achieve this. Conditional breakpoints allow you to switch to debug mode only if any particular condition that was set has been reached. Conditional breakpoints help you avoid manual study of the code with its further execution, and can also make the whole debugging process not requiring your manual intervention and relieve you from boring work.
How to enable Conditional Breakpoint (conditional breakpoint)
Setting conditional breakpoints in reality is simple. Press F9 in the code to set a point on a certain line ( note, you can also set a breakpoint by clicking the mouse on the left edge of the editor window exactly at the line level where you need to set a breakpoint ):
Then right-click on the red circle of the breakpoint to the left of the editor window and select the context menu “Condition ...”:
This will bring up a dialog box that allows you to specify that the breakpoint should only work if a certain condition is true. For example, we can specify that we do not need to go to debugging if the size of the local paginatedDinners list is less than 10, by typing the following expression below:
Now, when I restart the application and perform a search, the debugger will be enabled only if I perform a search that returns less than 10 dinners. If there are more than 10 dinners, then the breakpoint will not be reached.
Hit Count function
Sometimes you need to stop the debugger only if the condition is true N-times.
For example, to stop only if the search has already returned less than 10 dinners 5 times.
You can enable this behavior by right-clicking on the breakpoint and selecting the menu item “Hit count ...” (“Number of hits ...”).
This will bring up a dialog box that allows you to specify that the breakpoint should be reached only N-times when the condition is reached either every N-times when it is reached, or every time after N occurrences:
Filtering by Machine / Thread / Process (Machine Name / Thread / Process)
You can also right-click on a breakpoint and select the “Filter ...” item from the context menu to indicate that the breakpoint should be reached if the debugging process occurs on a specific machine or in a specific process or in a specific thread.
Tracepoints - custom events when they hit a breakpoint
The debugger feature many people don’t know is the ability to use TracePoints . A trace point is a breakpoint at which a user event is triggered. This functionality is especially useful when you need to track the behavior in your application without stopping in debugging.
I use a simple console application to demonstrate how we could use Trace Points. The following is a recursive implementation of the Fibonacci series :
In the application above, we use Console.WriteLine () to output the final value of a series for a specific range value. What if we wanted to track the recursive sequence of the Fibonacci series in action while debugging — without actually stopping or suspending it? Trace points can help us do this easily.
Set Trace Point (TracePoint)
You can turn on trace points by using the F9 key to set a breakpoint in the code line and then right-click on the breakpoint and select the "When Hit ..." option from the context menu:
This will bring up a dialog box that allows you to specify what should happen when a breakpoint is reached:
Above, we indicated that we want to output a trace message every time a breakpoint condition is reached. Notice that we have indicated that we want to output the value of the local variable “x” as part of the message. Local variables can be referenced using the {variableName} syntax. There are also built-in commands (such as $ CALLER, $ CALLSTACK, $ FUNCTION, etc.) that can be used to display common values in your trace messages.
Above, we also checked the “continue execution” checkbox below, which indicates that we do not need the application to stop in the debugger. On the contrary, it will continue to be executed only with the difference that our custom trace message will be displayed every time the breakpoint conditions are reached.
And now, when we run the application, we will see that our custom trace message is automatically displayed in the Visual Studio “output” window, allowing us to monitor the recursive behavior of the application:
As an alternative to the method described above, you can create a custom trace listener for your application; in this case, the messages generated at the trace points will be redirected to it instead of the VS. output window.
Trace Points (TracePoints) - Custom Macro Execution
In the conversation that I had last week in London, someone in the audience asked if it was possible to automatically output local variables when the Breakpoint was reached (TracePoint).
This feature is not built into Visual Studio, but can be enabled using a custom macro and then setting up a trace point to invoke the macro when that point is reached. To do this, open the integrated environment for macros inside Visual Studio (Tools-> Macros-> Macros IDE menu command). Next, under the MyMacros node in the project browser, select a module or create a new one (for example: with the name “UsefulThings”). After that, paste the following macro code on VB into the module and save it:
Vb:
Sub DumpLocals()

Dim outputWindow As EnvDTE.OutputWindow

outputWindow = DTE.Windows.Item(EnvDTE.Constants.vsWindowKindOutput). Object

Dim currentStackFrame As EnvDTE.StackFrame

currentStackFrame = DTE.Debugger.CurrentStackFrame

outputWindow.ActivePane.OutputString( "*Dumping Local Variables*" + vbCrLf)

For Each exp As EnvDTE.Expression In currentStackFrame.Locals

outputWindow.ActivePane.OutputString(exp.Name + " = " + exp.Value.ToString() + vbCrLf)

Next

End Sub

* This source code was highlighted with Source Code Highlighter .
C #
void DumpLocals() {
EnvDTE.OutputWindow outputWindow;
outputWindow = DTE.Windows.Item[EnvDTE.Constants.vsWindowKindOutput].Object;
EnvDTE.StackFrame currentStackFrame;
currentStackFrame = DTE.Debugger.CurrentStackFrame;
outputWindow.ActivePane.OutputString(( "*Dumping Local Variables*" + "\r\n" ));
foreach (EnvDTE.Expression exp in currentStackFrame.Locals) {
outputWindow.ActivePane.OutputString((exp.Name + ( " = "
+ (exp.Value.ToString() + "\r\n" ))));
}
}

* This source code was highlighted with Source Code Highlighter .
The macro code given above cycles through the current stack and outputs all variables to the output window.
Using our custom DumpLocals macro
Then we can use our custom macro “DumpLocals” a simple additional application, which is shown below:
We will use the F9 key to set a breakpoint on the return expression in our method.
“Add” above. Then right-click on the breakpoint and select the “When hit” command from the context menu:
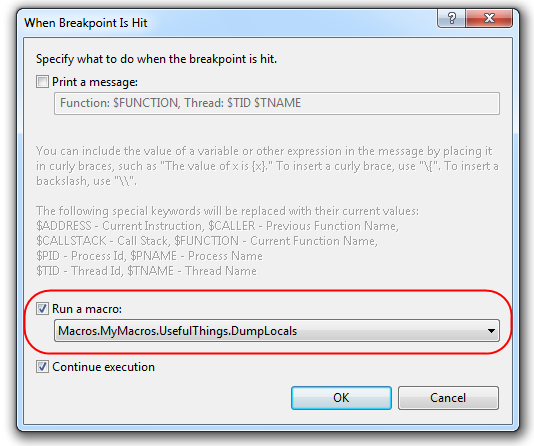
This will bring up the following dialog box. Unlike the previous code, where we used the “Print a message” checkbox and manually defined the variables we want to output, this time we will select the Run a macro checkbox instead. and specify the macro UsefulThings.DumpLocals which we created above:
We will leave the “continue execution” flag so that the program continues to run even after reaching the Trace Point.
Application launch
And now, when we press the F5 key and run the application, we will see the following output in the “output” window of Visual Studio when our Add method is launched. Notice how the macro automatically lists in the list the name and value of each variable when the Trace Point is reached:
Total
The Visual Studio debugger is incredibly rich in functions. I strongly recommend taking some time to really explore all its possibilities. The tips and tricks described above represent only a small fraction of its capabilities that people are not really aware of.
Last time I wrote a blog about other improvements in the VS 2010 debugger (including displaying a data type prompt (DataTip), Import / Export breakpoints, Saving the latest values of variables, and much more). I will continue to write in the blog about the new features of VS 2010: Intellitrace, as well as support for debugging the dump file. Publications will describe a bunch of additional cool new features that can make debugging applications even easier.
Also, do not forget to watch the excellent series of Scott Kate Visual Studio 2010 Tips and Tricks to learn how best to use Visual Studio. He has an unparalleled set of free videos and blog posts.
Hope this helps,
Scott
PS In addition to blog posts, I also now use twitter for quick updates and link exchange. Follow me: twitter.com/scottgu
Source: https://habr.com/ru/post/102178/
All Articles