Using Intel Concurrency Checker in practice - some questions ...

In the past six months, I have been actively falling off offers to “touch” Intel Concurrency Checker, both directly from the Intel partner program, and indirectly, for example, in Sergey Vilyanov’s blog ( here ). For a long time I refused this tempting offer. And recently I gave up. Under the cut - my experience using this tool. I must say that the tool left me in complete bewilderment. Why? I'll tell you now. I will answer in advance the question what this post is doing on Intel's blog. I think it is better to comment on the company's products here, and not in a personal blog.
So, the official page on the Intel site reads:
')
Intel Concurrency Checker tool for evaluating multi-core processor performance. Use the Intel Concurrency Checker tool to assess how well the performance of your application scales on a multi-core processor system.
It seems to be tempting. Having
Then a colleague offered to open the source code of the page and try to find the download link in it. Fortunately, such a half-hacker method allowed me to get this program. Surprisingly, I downloaded not a distribution kit, but a java-application. I also had to download Java myself. Ok, downloaded, launched.
“What would I check for multitasking?”, I thought and launched Starcraft 2 :-). No, do not think that I immediately wanted to play. The point is that to evaluate an application in Concurrency Checker, this application must be launched and let it work for 30 seconds. Concurrency Checker at this time considers the CPU load, the use of cores, etc. So, as a result of measuring Starcraft 2, I received the following picture.
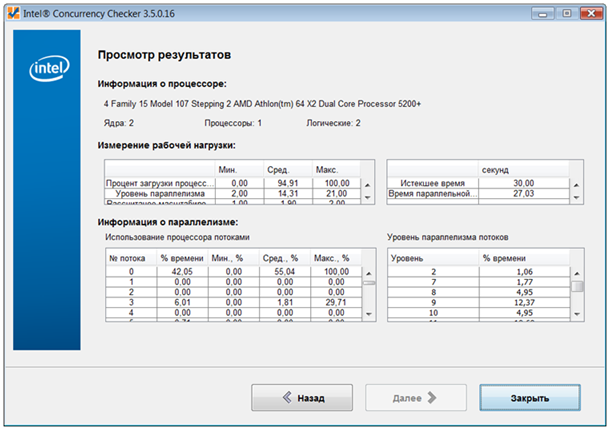
Although it is possible to guess from the tablet that Starcraft 2 is a multi-core application, the instruction to Concurrency Checker in Russian doesn’t hurt.
In the developers of Starcraft 2, no one doubted. Therefore, it is interesting to evaluate your application, for example, (aha) the PVS-Studio static code analyzer. Since PVS-Studio works as an extension module (plug-in) for Microsoft Visual Studio, you actually need to evaluate the performance of this environment.
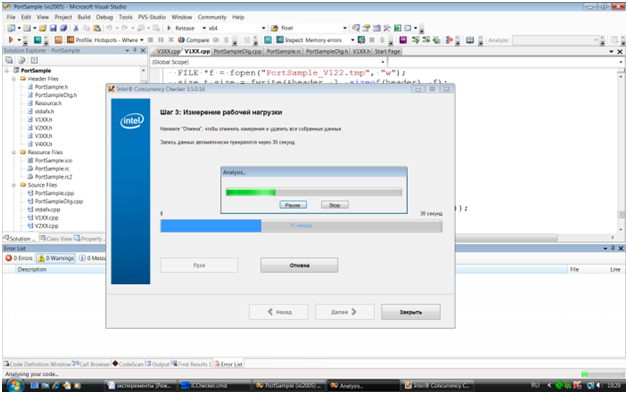
The result was expected.
As expected, the percentage of CPU usage averaged 1.61%, since the Visual Studio environment itself practically did not work. After all, the code analysis module PVS-Studio.exe is a separate application that runs for each file being analyzed (with its own set of parameters).
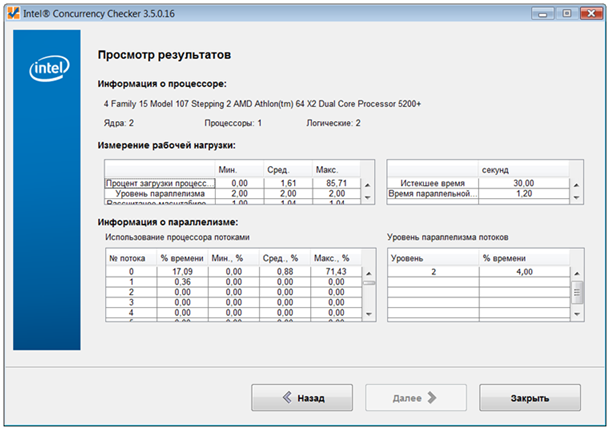
Maybe, if you run only the PVS-Studio.exe analysis module itself (for example, for executing internal tests), the result will be unexpected?
No, the result is again expected. The PVS-Studio.exe analysis module is a single-threaded application without any parallelism. This is absolutely logical and understandable, since in the analyzer parallelism is achieved by analyzing several files in parallel, that is, by running several versions of PVS-Studio.exe in parallel. And, of course, this configuration Concurrency Checker "does not recognize" and shows that everything is bad.
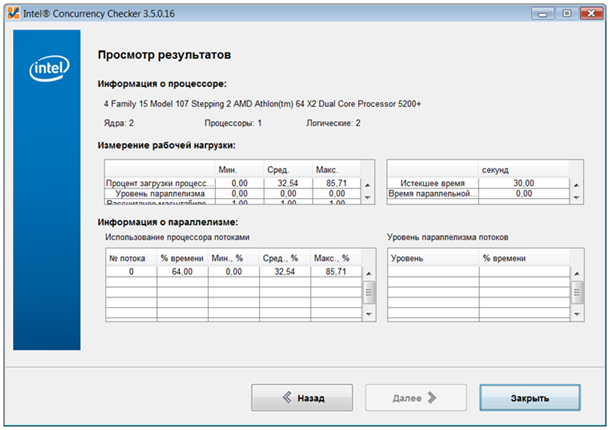
Okay, let's give the tool a simpler puzzle. Let us check how efficiently several kernels are used in the 7z archiver.

The plate shows that 7z is very coolly controlled with several cores. But I have a question! Isn't the Task Manager visible from the same?
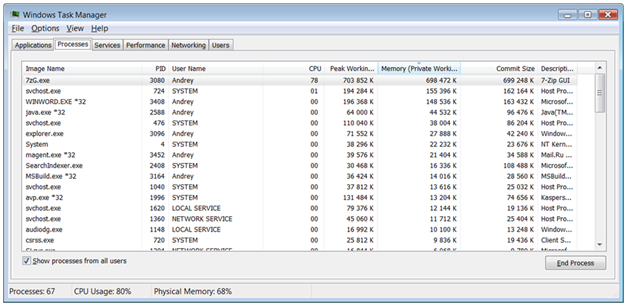
It seems to be seen ... So for me, frankly, it remains a mystery who needs the Intel Concurrency Checker program. And that's why:
- Whether several cores are used or not, you can always look in Task Manager.
- A team of programmers who develop a project always, without any tools, knows how to deal with concurrency in their code. If no one has ever "parallelized" the code, then there is no place to take the support of several cores.
- For a more powerful analysis of parallelism and the search for bottlenecks, more other tools like Intel VTune are needed - also understood by everyone.
By the way, the program allows you to save the measurement log in Intel and get a comment from a specialist. But with this kind of obscurity. In the case of our PVS-Studio analyzer, if I send the measurement log to Visual Studio, it will be an incorrect measurement. If I send a log of measurements of the analysis module itself, I already know that it is single-threaded. Unclear...
True, I could not send any logs, because in the section “Send Report” I received the same white picture as in the first picture.
The questions for this program are related to the fact that the current version has a number already 3.5! What is surprising, since what can be developed in it is not clear. Moreover, I already thought that she had appeared, so at once 3.5 became. But no, in 2008, for example, there was version 2.1 of this tool. So it has a rather large life cycle (to the surprise).
My vision of this program is. Intel marketers came up with a cool idea - an easy assessment of the level of using multiple cores in a program. They came to the programmers, asked to do. Programmers have done, because to argue is more expensive. As a result, the product is there, it works, but who needs it and why is it not clear? Maybe marketers to draw beautiful graphs about the level of use of cores?
PS It would seem, where is Intel? Unlike Channel One, on which no one ever criticizes itself, in technology companies it is useful to receive criticism from a person with a straightforward look. And maybe Intel will improve the positioning of this program, saying why it is needed. Or it may turn out that she doesn’t really need it :-).
Source: https://habr.com/ru/post/101866/
All Articles