GTK Graphics #
I have repeatedly had the need to build simple graphics in my applications, but every time I didn’t have the right tool at hand. This time I discovered the NPlot library, which seemed quite convenient to me.
Why is NPlot so good? There is not a single library for plotting graphs, but many of them work only under .NET or are too tied to Windows.Forms. But I'm interested in cross-platform, that is, I need something compatible with mono and gtk. NPlot meets these requirements, and it is licensed under BSD, which is also nice.
However, familiarity with NPlot was overshadowed by the lack of normal documentation. And the test case that comes with the library works terribly:
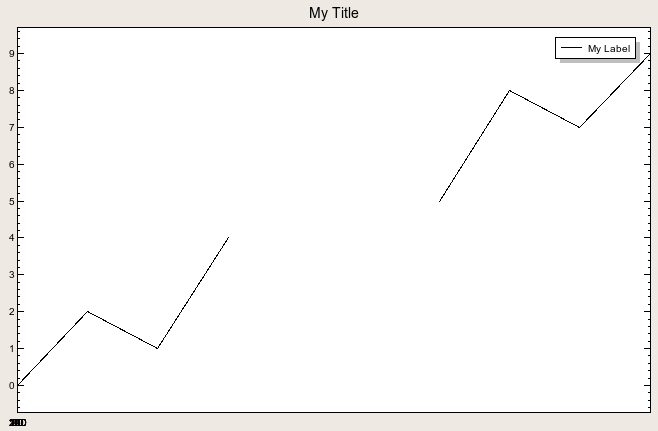
But nevertheless, it is clear that the main function - drawing graphs - is performed by NPlot, and therefore I decided to sort it out and write some sort of documentation. Perhaps someone will come in handy.
')
First of all, you need to draw the graphic lines themselves:
When all the lines are drawn, it's time to take up the plane of the graph, where they will be displayed:
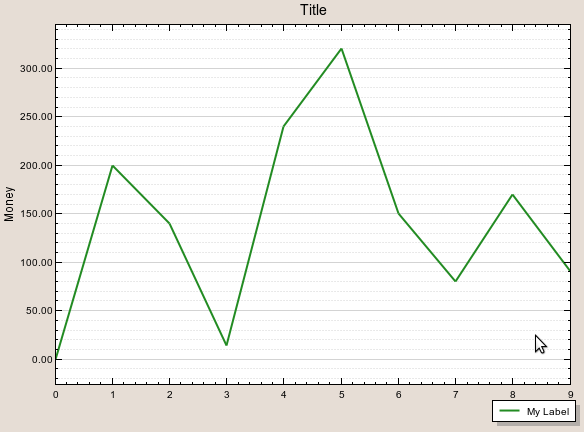
The result is a simple and high-quality image.
As I understand it, the functionality is not limited to this and the project is not dead yet (the last message “Code Committed” at Sourceforge was only 64 days ago). In process of studying of NPlot I will add article.
Why is NPlot so good? There is not a single library for plotting graphs, but many of them work only under .NET or are too tied to Windows.Forms. But I'm interested in cross-platform, that is, I need something compatible with mono and gtk. NPlot meets these requirements, and it is licensed under BSD, which is also nice.
However, familiarity with NPlot was overshadowed by the lack of normal documentation. And the test case that comes with the library works terribly:
But nevertheless, it is clear that the main function - drawing graphs - is performed by NPlot, and therefore I decided to sort it out and write some sort of documentation. Perhaps someone will come in handy.
')
First of all, you need to draw the graphic lines themselves:
// , .
double [] a = {0, 200, 140, 14, 240, 320, 150, 80, 170, 90};
//
LinePlot lp = new LinePlot();
lp.DataSource = a;
lp.Label = "My Label" ;
// . System.Drawing.Pen
lp.Pen = PenName;
//
Grid myGrid = new Grid();
// , Vertical ,
myGrid.VerticalGridType = Grid.GridType.Fine;
// Horizontal — ,
myGrid.HorizontalGridType = Grid.GridType.None;

* This source code was highlighted with Source Code Highlighter .
When all the lines are drawn, it's time to take up the plane of the graph, where they will be displayed:
//, —
NPlot.Gtk.PlotSurface2D plot = new NPlot.Gtk.PlotSurface2D();
// ,
plot.Clear();
//
plot.Title = "Title" ;
//
plot.Legend = new Legend();
// -
plot.Legend.AttachTo(NPlot.PlotSurface2D.XAxisPosition.Bottom, NPlot.PlotSurface2D.YAxisPosition.Right);
// ,
plot.Legend.YOffset = 16;
//
plot.Legend.HorizontalEdgePlacement = Legend.Placement.Outside;
plot.Legend.VerticalEdgePlacement = Legend.Placement.Inside;
//
plot.Padding = 40;
// ,
plot.SmoothingMode=System.Drawing.Drawing2D.SmoothingMode.AntiAlias;
//
plot.Add(myGrid);
plot.Add(lp);
// , ,
plot.YAxis1.Label = "Money" ;
// ( — )
plot.YAxis1.NumberFormat = "{0:n}" ;
//
plot.Refresh()
* This source code was highlighted with Source Code Highlighter .
The result is a simple and high-quality image.
As I understand it, the functionality is not limited to this and the project is not dead yet (the last message “Code Committed” at Sourceforge was only 64 days ago). In process of studying of NPlot I will add article.
Source: https://habr.com/ru/post/101488/
All Articles