How Microsoft DevDiv uses TFS - part 6 (+ add-on) and 7
Track multiple projects.
Today, I'm going to show you how our program manager is responsible for managing all projects with TFS, using reports to track changes in several projects at once.
First, let me tell you a little about the process itself.
Every week we held meetings of managers whose goal was to check the health of the projects we worked on.
These meetings were held by Jim Boyle, who was the program manager of our group. He is an excellent program manager with extensive experience in supervising the performance of work.
Every week, Jim showed us a report that looked like this. He displayed all the projects we worked on.
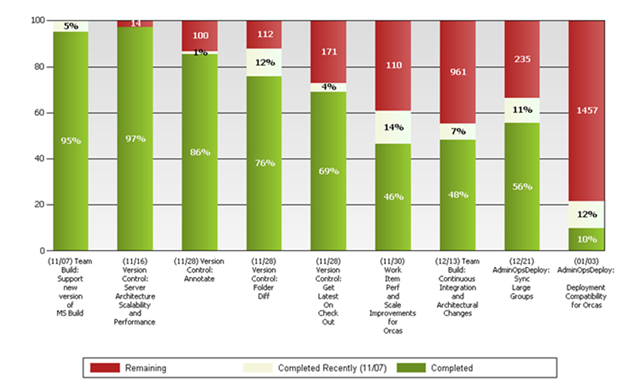
Some clarifications:
- Green - the percentage of completed work in relation to the entire project.
- Yellow - the percentage of work completed for the last reporting period (usually 1 week).
- Red - the number of hours of work to be done.
- The end date of the work on the functionality is accompanied by the name of the artist.
After this report was displayed, Jim started asking questions like these:
- Why not see any progress over the past week?
- Why so little is done?
- You have only 1450 working hours left, despite the fact that the end date is scheduled for January 3. Do you still think you will meet these deadlines?
Jim didn’t start knocking his fist on the table at all and asking, "What the fuck are you doing nothing about?" The given data showed a conflict, and he simply voiced it.
Here are some answers:
- "I just did not update the data." Such an answer was not acceptable. After such a response, a verbal flogging began with a reminder of the importance of updating the data in time. By the way, this was not done at all by Jim, but by our Product Unit Manager (read: Brian Harry).
- “We were pulled out to do other urgent work that week” - this answer was quite acceptable. Although at such meetings there was a change of priorities. In other words, the management could understand that this urgent work is not as important as the project as a whole. In this situation, the management had a more complete picture of the status of the project.
- “If everything goes well and there are no difficulties and problems, I hope we will do everything on time” - here we see how someone tries his best to believe that he can keep the initial deadlines. He does not want to move the date, because it will not look very good. Basically, the answer to him was: we need a date by which the work will be done with the maximum probability. If you need to move it, we better know about it now than move it later.
You may have noticed that this approach requires changing the culture within the team. Transparency will make you express yourself. With such a culture of openness, management can take the path of “keep the date of completion of works at any cost”, and performers must decide “to show the current status of the project with all the openness” or “hide the bad news”. It was a learning process for both parties.
Gregg boer
Addition.
After the publication of the previous article, I was asked to tell in more detail about the report about which I spoke. I asked a friend who is working on internal reports, and here is his answer (Thank you, Doug!). I also attach the .RDL file that he gave me.
Quote:
“Below is the text of the request, which receives the current volume of completed and pending work on a certain past date (and this date is a parameter). The purpose of using fields. [All] in our measurement system, which returns the amount of work for a period of N days, is to search for scenarios that have a name, product group, current status, etc. had a different meaning on the specified date. In essence, we say: give me the volume of completed and pending work for a period of N days regardless of the filter values for other fields (for example, status, etc.).
WITH
MEMBER [Measures]. [ValueOfCompletedWorkAsOfNDaysAgo] AS
(
[Measures]. [Microsoft_VSTS_Scheduling_CompletedWork],
[Work Item]. [Microsoft_DeveloperDivision_Classifications_Group]. [All],
[Work Item]. [Microsoft_DeveloperDivision_Classifications_Project]. [All],
[Work Item]. [System_Title]. [All],
[Work Item]. [System_State]. [All],
[Work Item]. [Microsoft_DeveloperDivision_Features_RiskLevel]. [All],
STRTOMEMBER (@MDXDateForWorkCompletedSinceDate)
)
MEMBER [Measures]. [ValueOfRemainingWorkAsOfNDaysAgo] AS
(
[Measures]. [Microsoft_VSTS_Scheduling_RemainingWork],
[Work Item]. [Microsoft_DeveloperDivision_Classifications_Group]. [All],
[Work Item]. [Microsoft_DeveloperDivision_Classifications_Project]. [All],
[Work Item]. [System_Title]. [All],
[Work Item]. [System_State]. [All],
[Work Item]. [Microsoft_DeveloperDivision_Features_RiskLevel]. [All],
STRTOMEMBER (@MDXDateForWorkCompletedSinceDate)
)
MEMBER [Measures]. [FeatureEndDate] AS
EXTRACT (
NonEmpty (
[Microsoft_DeveloperDivision_Features_DateEnd]. [Date]. [Date] *
[Work Item]. [System_Id] .CurrentMember,
[Measures]. [Current Work Item Count]
),
[Microsoft_DeveloperDivision_Features_DateEnd]. [Date]
) .Item (0) .Member_Value
SELECT
Non Empty
{
[Measures]. [FeatureEndDate],
[Measures]. [Current Work Item Microsoft_VSTS_Scheduling_CompletedWork],
[Measures]. [Current Work Item Microsoft_VSTS_Scheduling_RemainingWork],
[Measures]. [ValueOfCompletedWorkAsOfNDaysAgo],
[Measures]. [ValueOfRemainingWorkAsOfNDaysAgo]
} ON COLUMNS,
NonEmpty (
STRTOSET (@WorkItemMicrosoftDeveloperDivisionClassificationsGroup, CONSTRAINED) *
STRTOSET (@WorkItemMicrosoftDeveloperDivisionClassificationsProject, CONSTRAINED) *
[Work Item]. [System_Id]. [System_Id] *
[Work Item]. [Microsoft_DeveloperDivision_Features_RiskLevel]. [Microsoft_DeveloperDivision_Features_RiskLevel] *
[Work Item]. [System_Title]. [System_Title],
[Measures]. [Current Work Item Count]
) DIMENSION PROPERTIES MEMBER_CAPTION, MEMBER_UNIQUE_NAME ON ROWS
FROM [Current Work Item]
WHERE
(
[Work Item]. [System_WorkItemType]. & [Orcas Feature],
STRTOSET (@WorkItemSystemState, CONSTRAINED)
) "
FC-High-Level-Summary-of-Work.rdl
')
Gregg boer
Risk tracking
Last time we talked about tracking the progress of work in several projects at the same time, in this we will talk about tracking risks in these projects.
First of all, let's take a look at the Progress tab of the Feature type entry.
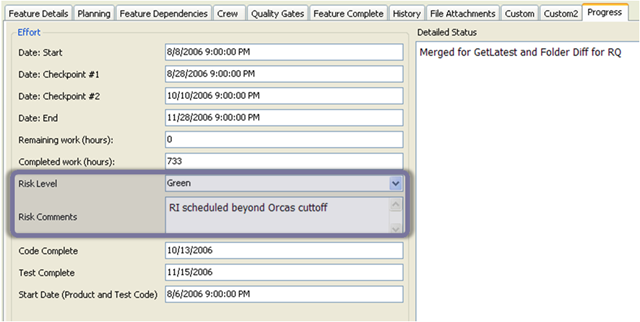
In this picture you see two fields related to risks. Risk Level (Risk Level) - an indicator of the type of traffic light. Green = we will complete work on time. Yellow = there are risks. Red = we will not complete work on time. The second field contains explanatory text.
Every week, the project manager had to check the dates specified in the Feature type record and assess whether his team can complete the work within the specified time frame and then set the Risk Level in accordance with this estimate. If needed, comments were added to the Risk Comments field.
The result is a report:

This report was created in Excel, which used the query, where Risk Level <> Green. The background color is added using Excel itself.
Every week, the team of any project that established itself in a non-green risk zone had to explain to other teams how they got to such a life and what they do (or should do) to return to the green zone.
If this risk simply reflects changes in the schedule, then it must be set in the red zone for one week so that everyone can understand that the schedule has been changed, and why it happened, that the end date has been updated. Then this risk returns to the green zone.
You might think that the above report resembles a snowfall / ice storm forecast. We in Seattle are not coping well with snowfall. Perhaps you just laugh at it, but I think the locals understood me perfectly. :)
How to make this system work?
You may ask: why should someone actually honestly show their risks as yellow or red? Why not just leave them green? It won't be so hot, will it?
I have two answers to this.
The first. Of course, if the project has a problem, the team will have to move dates. If suddenly their dates one day move by 4 weeks without first changing the risks, others may ask: “Why did you not know about this before?” Or “If you knew about it beforehand, why did you not tell us?”. This allows you to maintain honesty between the teams.
The second is a change in culture. Changing the level of risk does not always mean that you did something wrong. Very often, risks are beyond your control. However, it is within your power to report status changes. In fact, people were responsible for informing, not for project risks. Of course, if you change your dates very often, someone from the authorities will definitely talk to you.
Next time we’ll talk about how we controlled quality features (quality gates) using this system.
Source: https://habr.com/ru/post/101285/
All Articles